Gold Price Forecast: $1,791, US inflation to test XAU/USD bulls – Confluence Detector
- Gold price regains upside momentum after posting the biggest daily fall in a week.
- US Dollar retreat, mixed concerns surrounding CPI enables XAU/USD buyers to remain hopeful.
- Hawkish Fed bets, multiple hurdles to the north challenge Gold buyers ahead of US CPI.
Gold price (XAU/USD) grinds higher as bulls struggle to retake control amid a cautious mood ahead of the US Consumer Price Index (CPI) on early Tuesday. That said, the yellow metal’s latest run-up to $1,785 remains elusive as our technical confluence indicator shows that the quote is yet to cross the key hurdles.
It’s worth noting that the mixed precursors for the US inflation joined cautious optimism surrounding China, as well as sluggish Treasury bond yields to underpin the Gold price recovery. Also likely to have favored the XAU/USD rebound is the market’s inaction that allows traders to consolidate the biggest daily fall in a week.
That said, the US CPI for November, expected 7.3% YoY, versus 7.7% prior figure, will be crucial for intraday Gold traders. It should be noted that the CPI ex Food & Energy appears to be the key and is expected to be unchanged at 0.3% MoM, which can please the DXY buyers and weigh on XAU/USD should it manage to post the positive surprise.
Also read: Gold Price Forecast: XAU/USD confirms bearish wedge ahead of United States inflation data
Gold Price: Key levels to watch
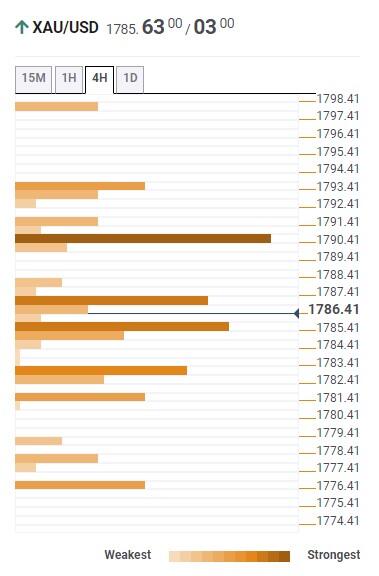
The Technical Confluence Detector shows that the Gold price recently crossed the short-term key hurdle and is ready to confront another one surrounding $1,788 that comprises the previous monthly high and 100-HMA.
The quote’s further upside, however, hinges on a successful break of the $1,791 resistance confluence that includes the Fibonacci 61.8% on one-day, 50-HMA and middle Bollinger on the four-hour play.
Should Gold buyers manage to stay firmer past $1,791, Fibonacci 61.8% on weekly formation near $1,795 and previous daily high near $1,798 could challenge the XAU/USD bulls.
On the flip side, the $1,785 level encompassing Fibonacci 38.2% on a daily and SMA 5H on a four-hour timeframe restricts the immediate downside of the Gold price.
Following that, Fibonacci 38.2% on weekly and 10-HMA could act as the last defense of buyers around $1,783.
Should the quote remains bearish past $1,783, the odds of witnessing a slump towards $1,776, including Fibonacci 23.6% on weekly can’t be ruled out.
Here is how it looks on the tool
About Technical Confluences Detector
The TCD (Technical Confluences Detector) is a tool to locate and point out those price levels where there is a congestion of indicators, moving averages, Fibonacci levels, Pivot Points, etc. If you are a short-term trader, you will find entry points for counter-trend strategies and hunt a few points at a time. If you are a medium-to-long-term trader, this tool will allow you to know in advance the price levels where a medium-to-long-term trend may stop and rest, where to unwind positions, or where to increase your position size.