GBP/USD Technical Analysis: Skidding across the floor at 1.2700
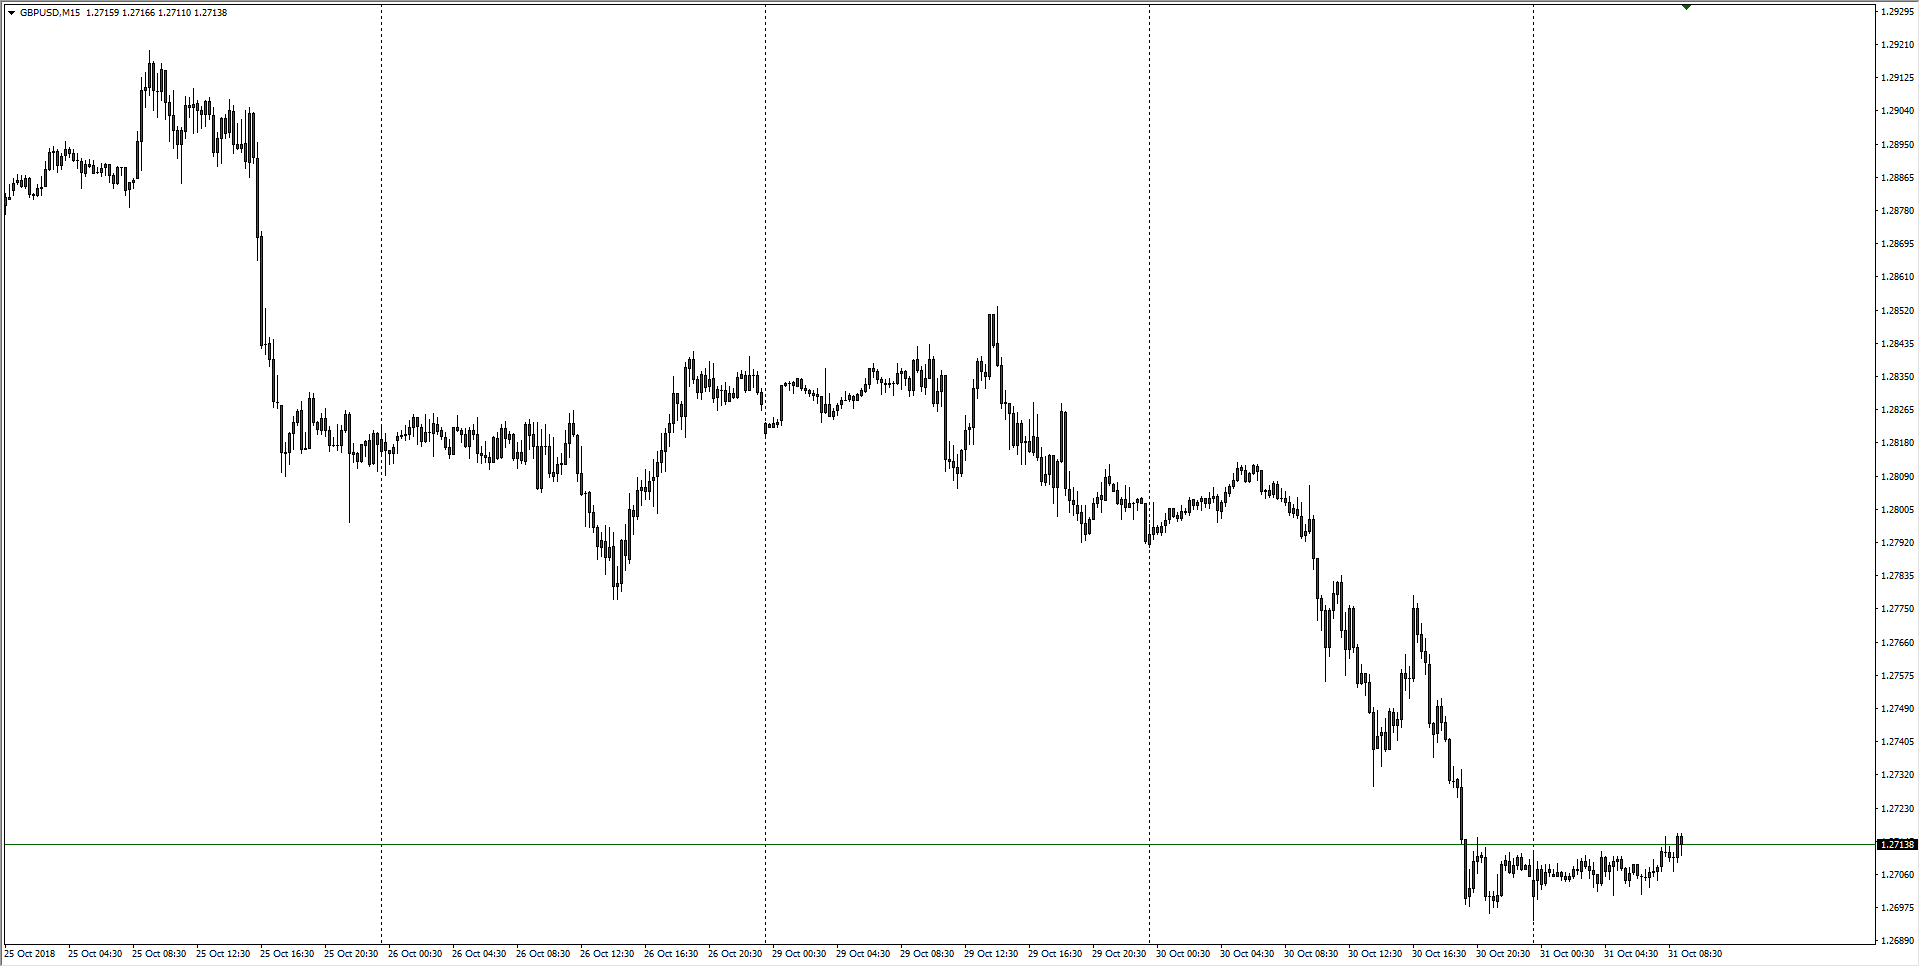
- The GBP/USD is trading stiffly into the 1.2700 technical barrier heading into Wednesday's London market session after seeing continuing Brexit declines, and the near-term pattern is lending itself to fast sell-offs followed by middling inaction.
- GBP/USD Forecast: Sterling trapped in a downward spiral near a 10-week low
- GBP/USD Forecast: Likely to defend YTD lows ahead of BoE’s Super Thursday
GBP/USD, M15
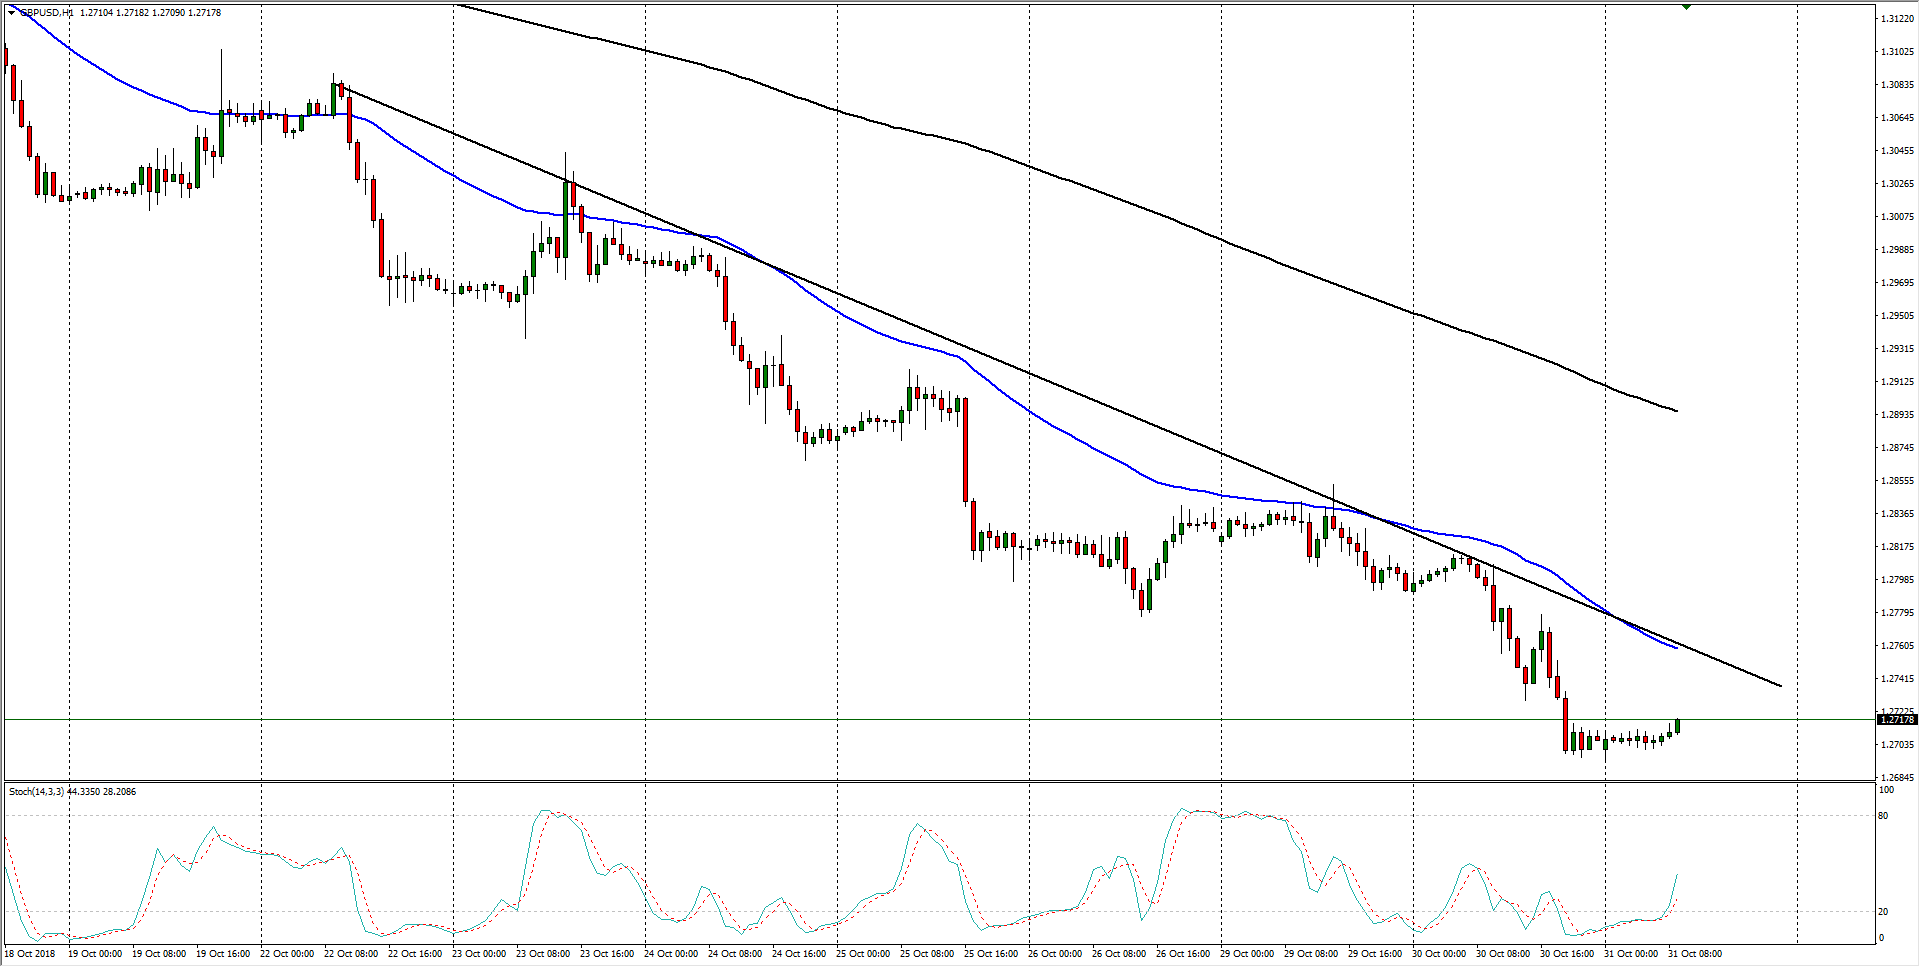
- Looking further out, the Cable remains underneath a rock-solid declining trendline with the 50- and 200-hour moving averages pinned firmly in a bearish trend.
GBP/USD, H1
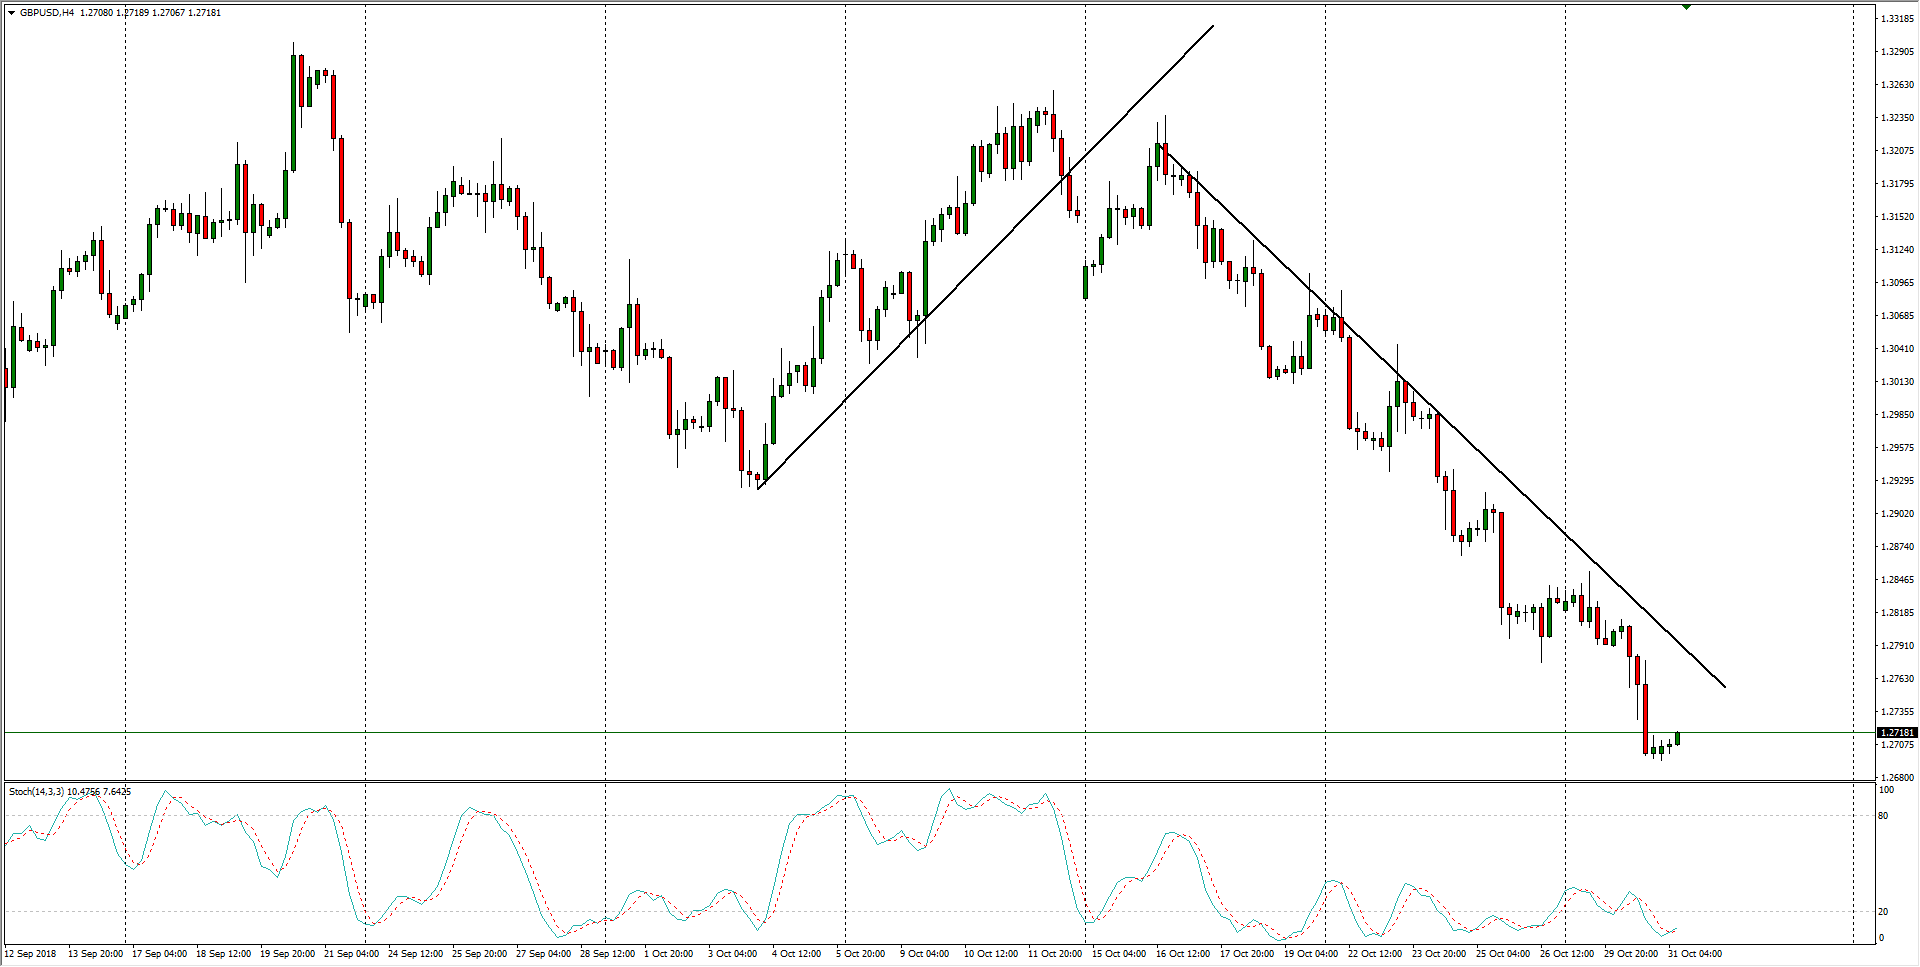
- On the H4 candles, the effects of Brexit fears is a clear picture of risk-off in the Cable, and the GBP/USD is trapped in a easy-to-ride bearish pattern.
GBP/USD, H4
Don't forget to check out FXStreet's own live chart to see instant GBP/USD updates!
GBP/USD
Overview:
Last Price: 1.2714
Daily change: 7.0 pips
Daily change: 0.0551%
Daily Open: 1.2707
Trends:
Daily SMA20: 1.302
Daily SMA50: 1.3018
Daily SMA100: 1.3054
Daily SMA200: 1.3447
Levels:
Daily High: 1.2814
Daily Low: 1.2696
Weekly High: 1.3092
Weekly Low: 1.2777
Monthly High: 1.33
Monthly Low: 1.2786
Daily Fibonacci 38.2%: 1.2741
Daily Fibonacci 61.8%: 1.2769
Daily Pivot Point S1: 1.2664
Daily Pivot Point S2: 1.2621
Daily Pivot Point S3: 1.2546
Daily Pivot Point R1: 1.2781
Daily Pivot Point R2: 1.2856
Daily Pivot Point R3: 1.2899