NZD/USD technical analysis: Struggles around 61.8% Fibo. amid overbought RSI after NZ data
- New Zealand Credit Card Spending grew past market consensus in June.
- The Kiwi pair struggles to extend break of 61.8% Fibonacci retracement amid overbought RSI.
Despite witnessing better than forecast spending data from New Zealand, the NZD/USD pair struggles to extend the latest rally as it trades near 0.6786 on early Friday.
June month Credit Card Spending (YoY) from New Zealand beat market expectations of 5.6% by matching the previous growth figure of 6.6%.
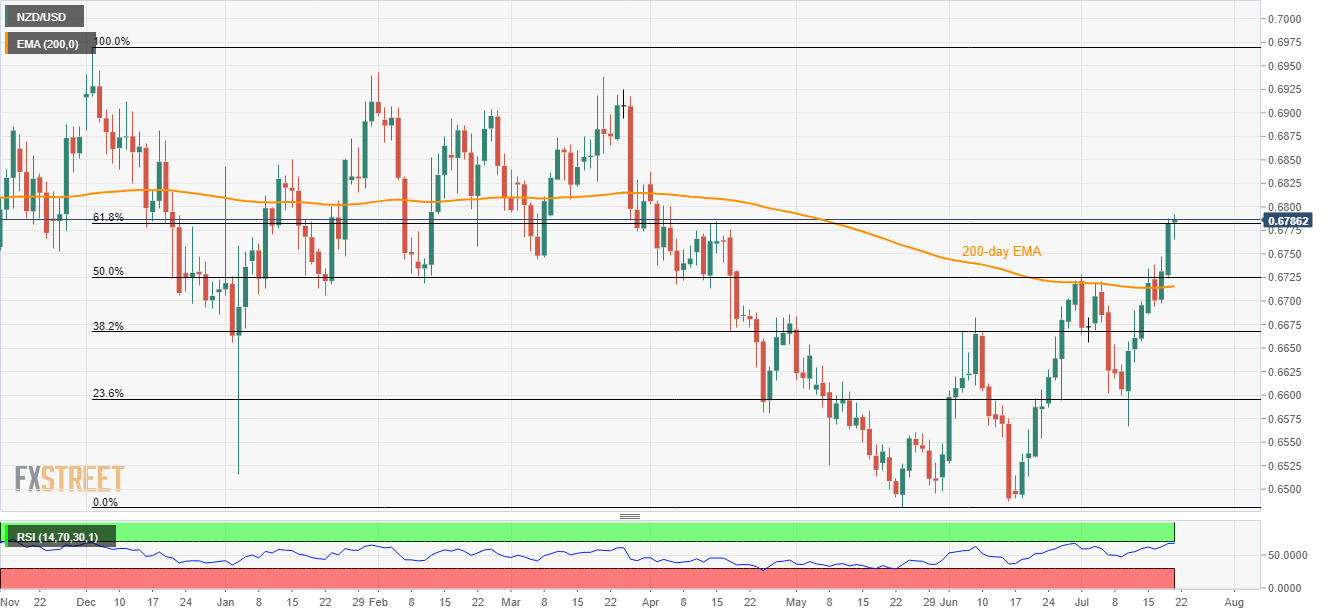
Given the overbought conditions of 14-day relative strength index (RSI), prices can revisit Wednesday’s high should they decline below 61.8% Fibonacci retracement level of December 2018 to May 2019 downpour, at 0.6780.
Additionally, 50% Fibonacci retracement and 200-day exponential moving average (EMA) can support the pair’s further declines around 0.6725 and 0.6715 respectively.
On the contrary, 0.6800 round-figure seems to hold the key for the quote’s extra rise towards April month high close to 0.6840. Also, pair’s run-up past-0.6840 may push the bulls to look for 0.6875 and 0.6900 mark.
NZD/USD daily chart
Trend: Pullback expected