Back
26 Jul 2019
AUD/USD technical analysis: Aussie challenging July lows near 0.6909 support
- AUD/USD is challenging the monthly lows near 0.6909 support.
- The levels to beat for bears can be seen near 0.6909 and 0.6960.
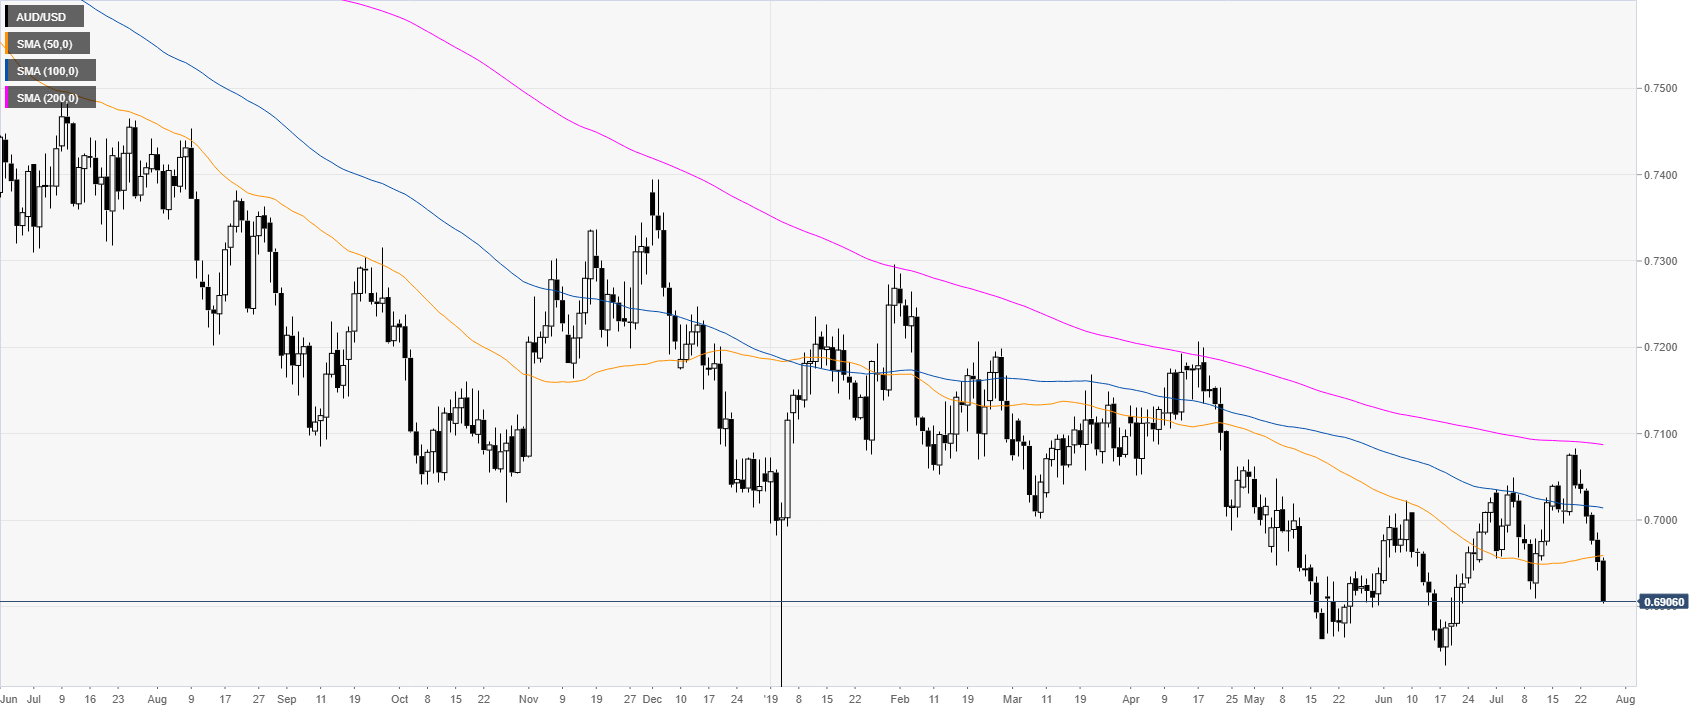
AUD/USD daily chart
The Aussie is trading in a bear trend below the main daily simple moving averages (DSMAs). The market broke to new July lows this Friday.
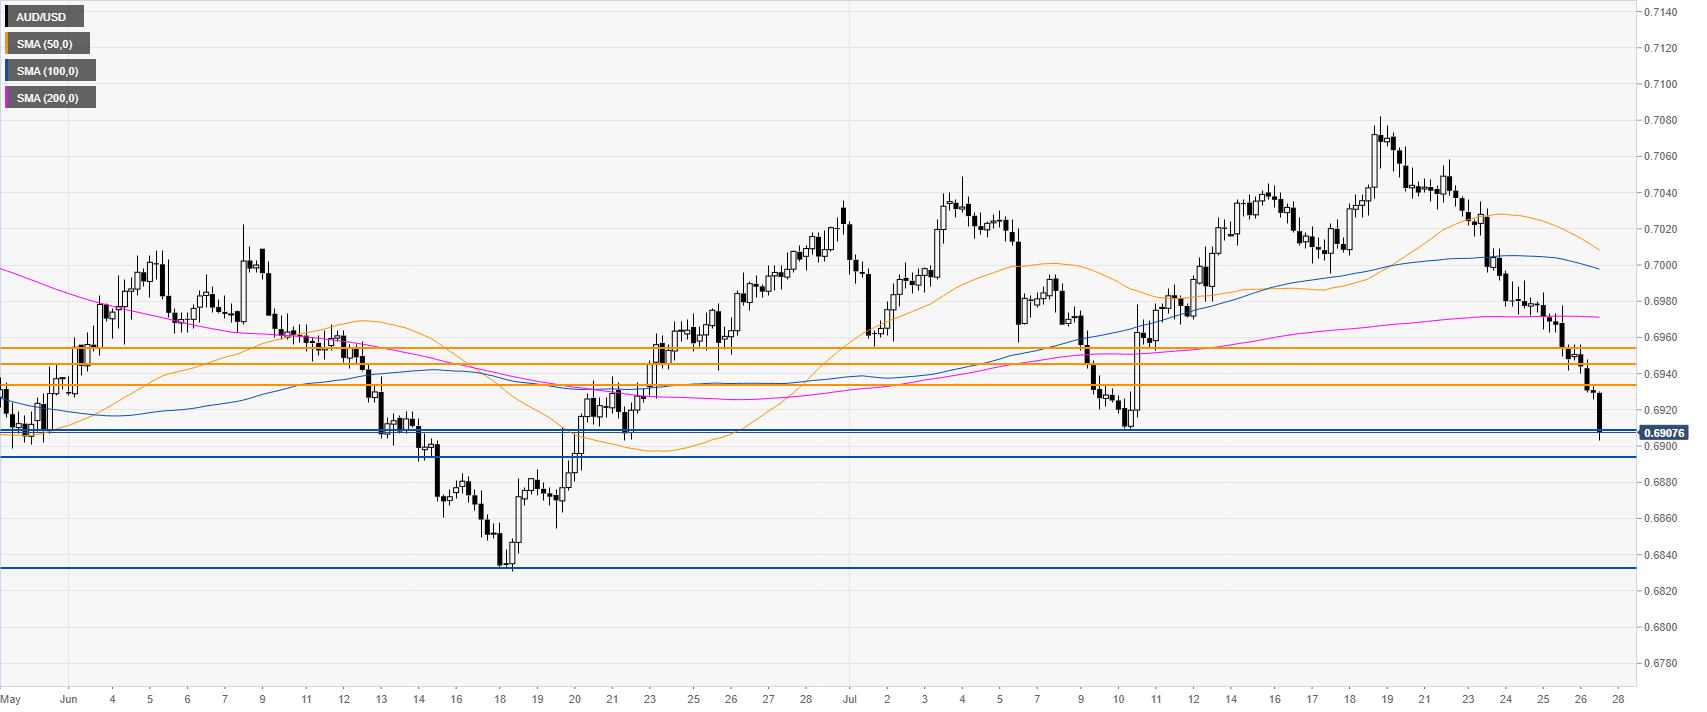
AUD/USD 4-hour chart
AUD/USD is challenging the previous July low near 0.6909 support. If bears break below this level the market could continue to decline towards 0.6894 and 0.6833, according to the Technical Confluences Indicator.
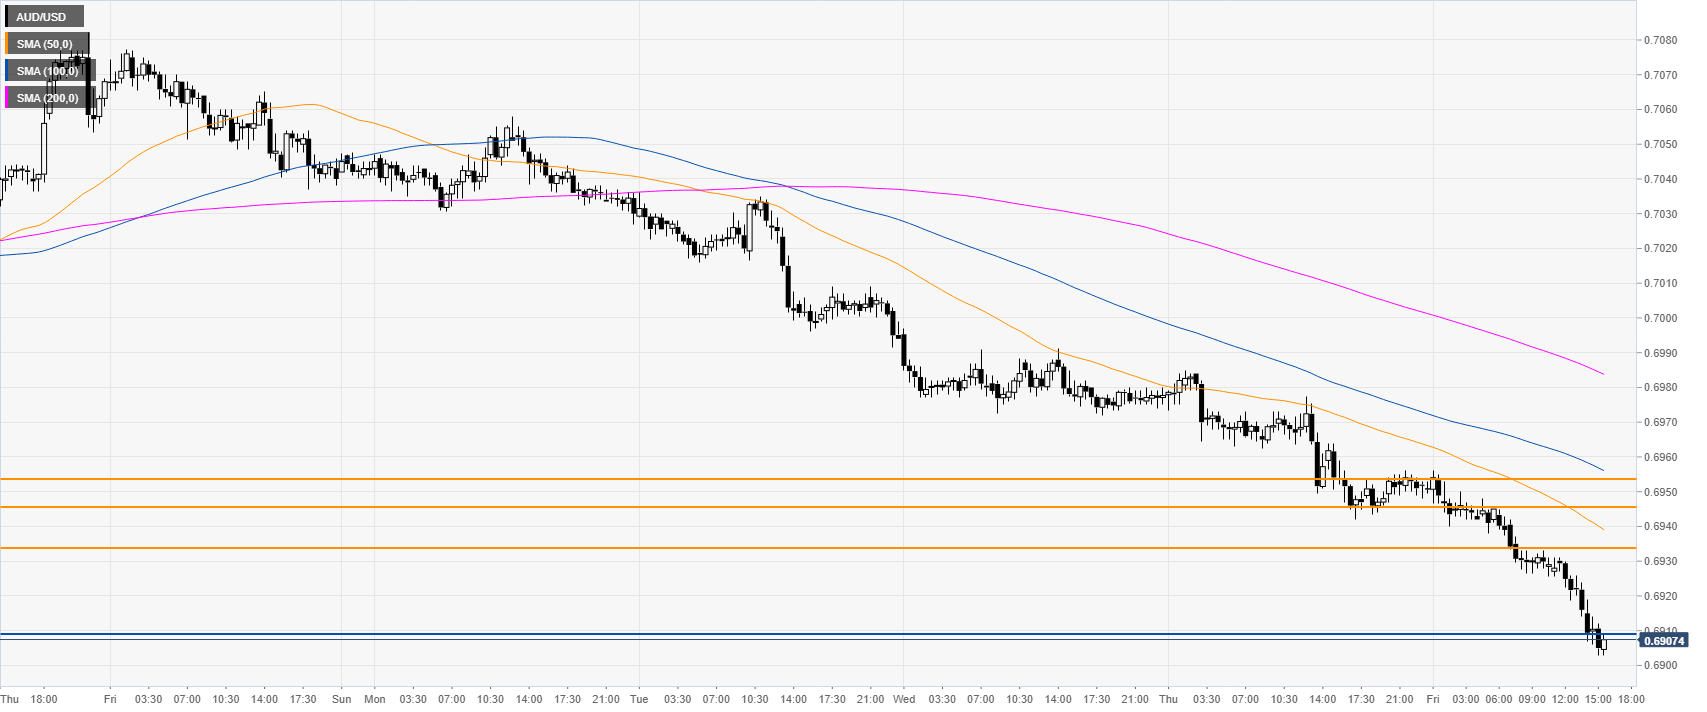
AUD/USD 30-minute chart
AUD/USD is trading below its main SMAs, suggesting bearish momentum in the near term. Immediate resistances can be seen near 0.6933, 0.6945 and the 0.6955 levels.
Additional key levels