Back
5 Aug 2019
S&P 500 Index technical analysis: Big bears shed blood in the Street as the trade war is taking its toll
- The S&P500 is in free fall as the trade war is sending Wall Street into a frenzy.
- The level to beat for bears are seen at the 2,847.00 and 2,813.00 levels.
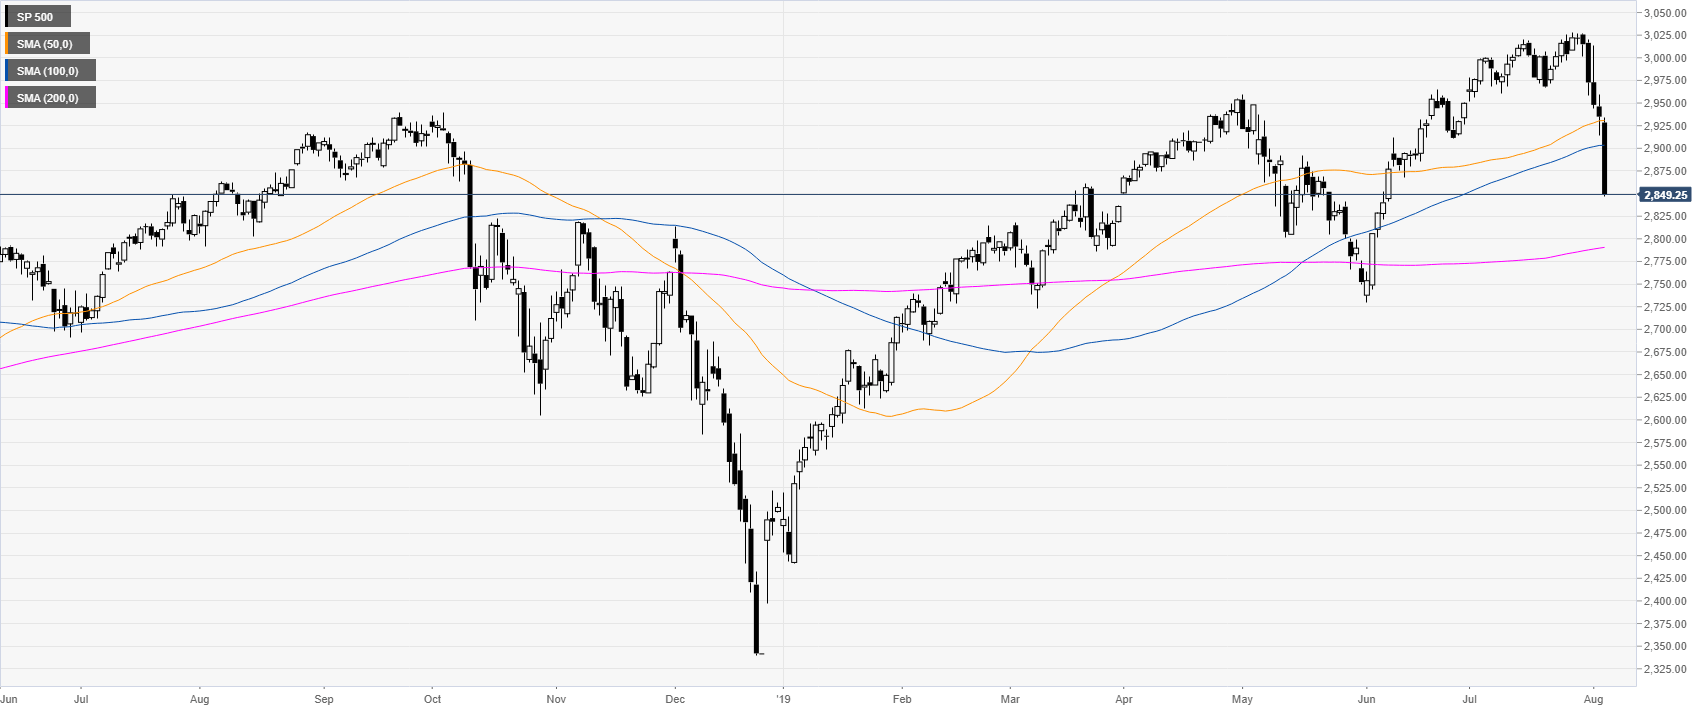
S&P500 daily chart
The S&P 500 Index is having a steep correction down as the market is trading below the 50 and 100-day simple moving averages (DSMAs). The US-China trade war is sending US stock market into panic mode.
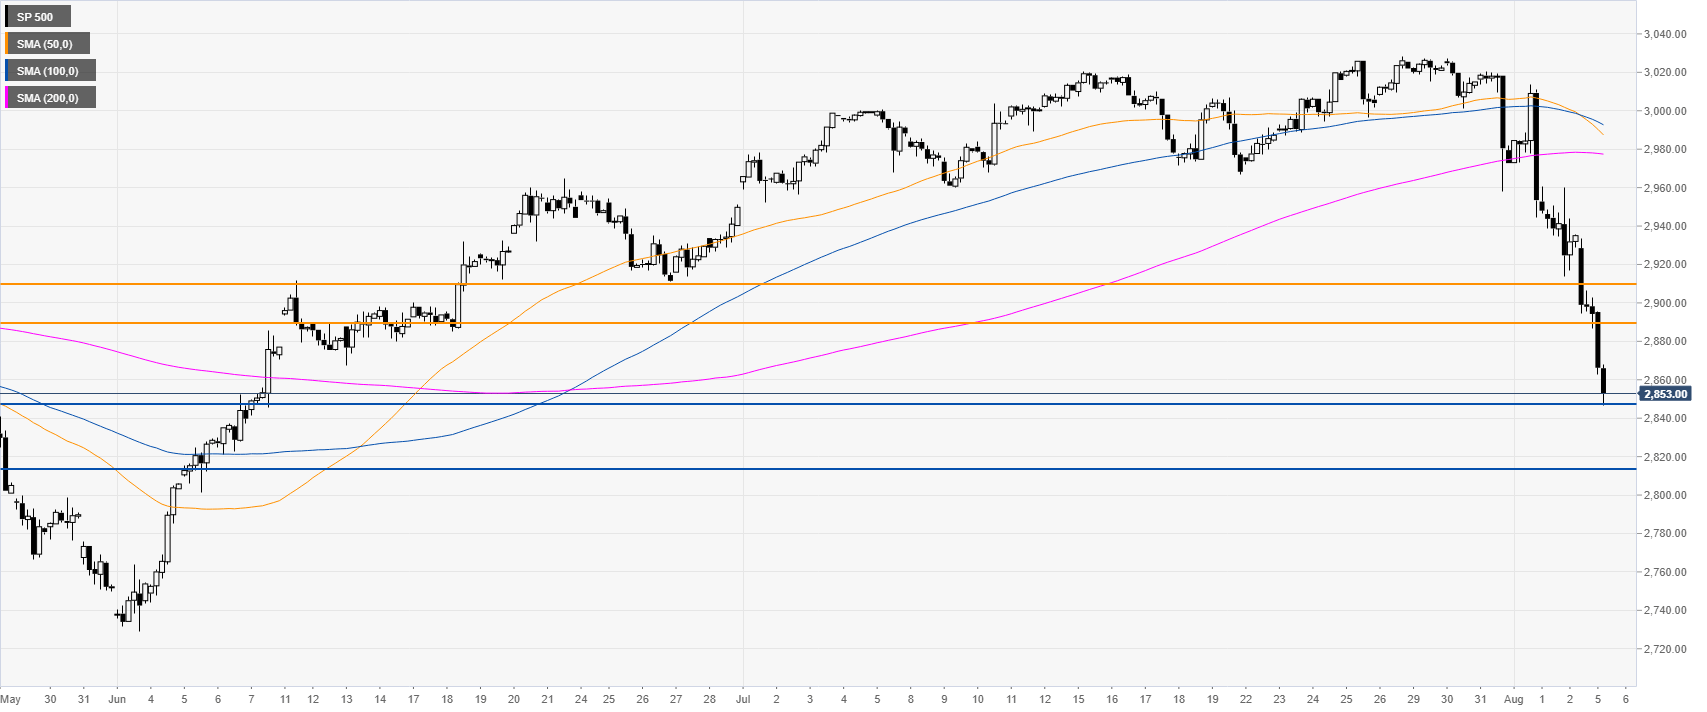
S&P500 4-hour chart
The market is having a vertical move down while slicing through many support levels and below the main SMAs. The bears are in control and their goal is to probably break below 2,847.00 to reach the 2,813.00 level.
S&P500 4-hour chart
The index is trading below its main SMAs, suggesting bearish momentum in the near term. Resistances can be located near the 2,890.00 and 2,910.00 levels.

Additional key levels