Back
23 Aug 2019
EUR/USD technical analysis: Sellers dominate below 1.1113/20 resistance-confluence
- EUR/USD remains on the back foot for more than a week.
- 200-HMA, multiple highs since August 15 limit near-term upside.
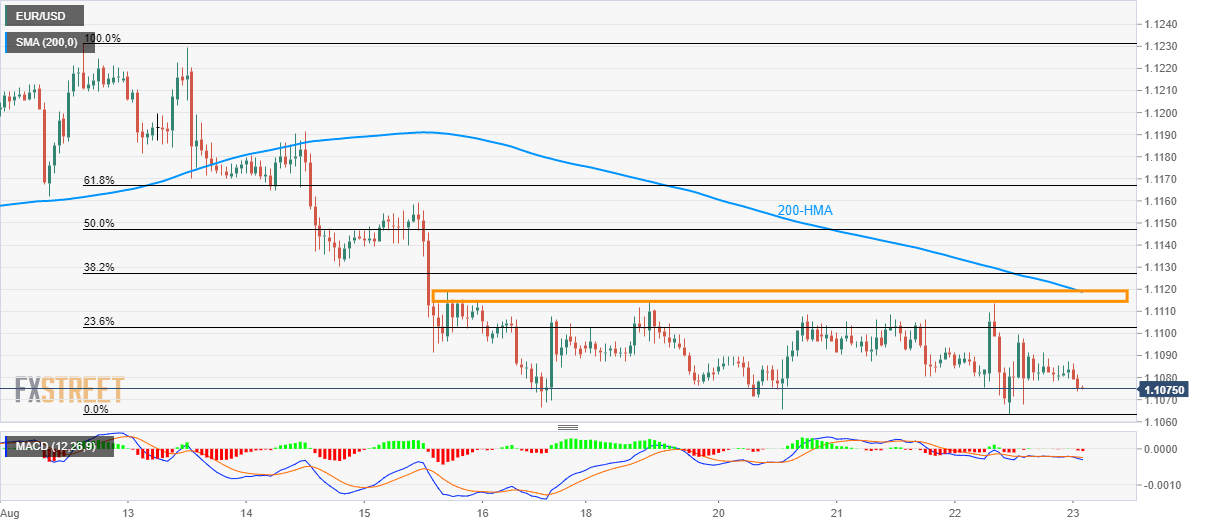
With the short-term key resistance-confluence has aptly been limiting the EUR/USD pair’s upside, the quote drops to 1.1073 during Asian session on Friday.
Prices are now likely declining towards 1.1066/63 area including latest lows while August 01 bottom around 1.1027 becomes the key support to watch.
On the upside, multiple tops since August 15 and 200-hour moving average (HMA) emphasize the importance of 1.1113/20 region as the resistance, a break of which can quickly propel prices to 1.1132 and 61.8% Fibonacci retracement level of 1.1167.
It should also be noted that 12-bar moving average convergence and divergence (MACD) indicator recently flashed bearish signal on the hourly chart.
EUR/USD hourly chart
Trend: Bearish