Back
31 Aug 2019
EUR/USD technical analysis: Euro at the edge of a deeper cliff
- EUR/USD fell to 2-year lows as the Greenback strengthened across the board this Friday.
- The level to beat for sellers is the 1.0961 support which can open the doors to 1.0870.
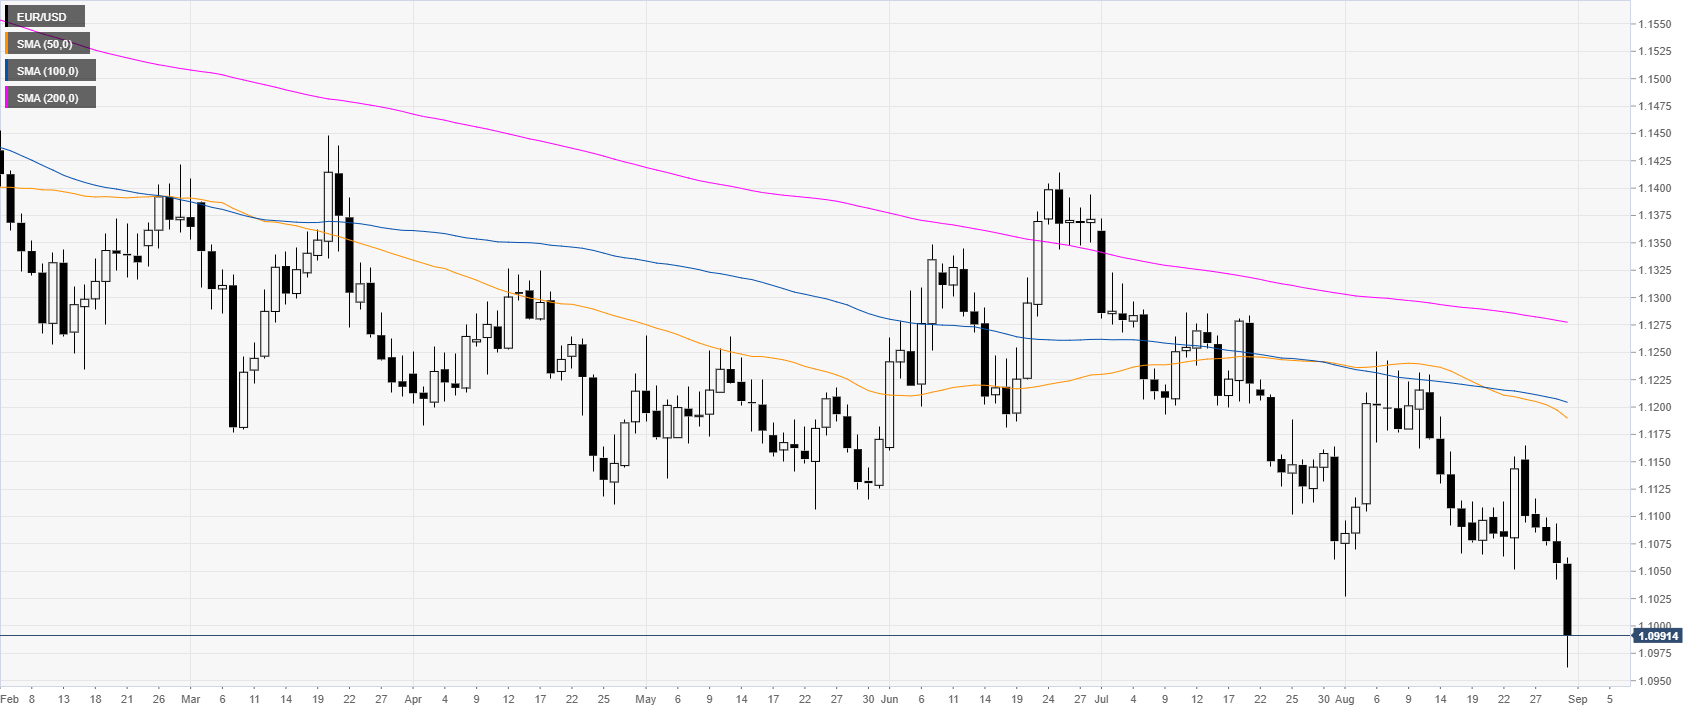
EUR/USD daily chart
On the daily time-frame, the common currency is trading in a bear trend below the main daily simple moving averages (DSMAs). This Friday, EUR/USD broke to its lowest level since May 2017.
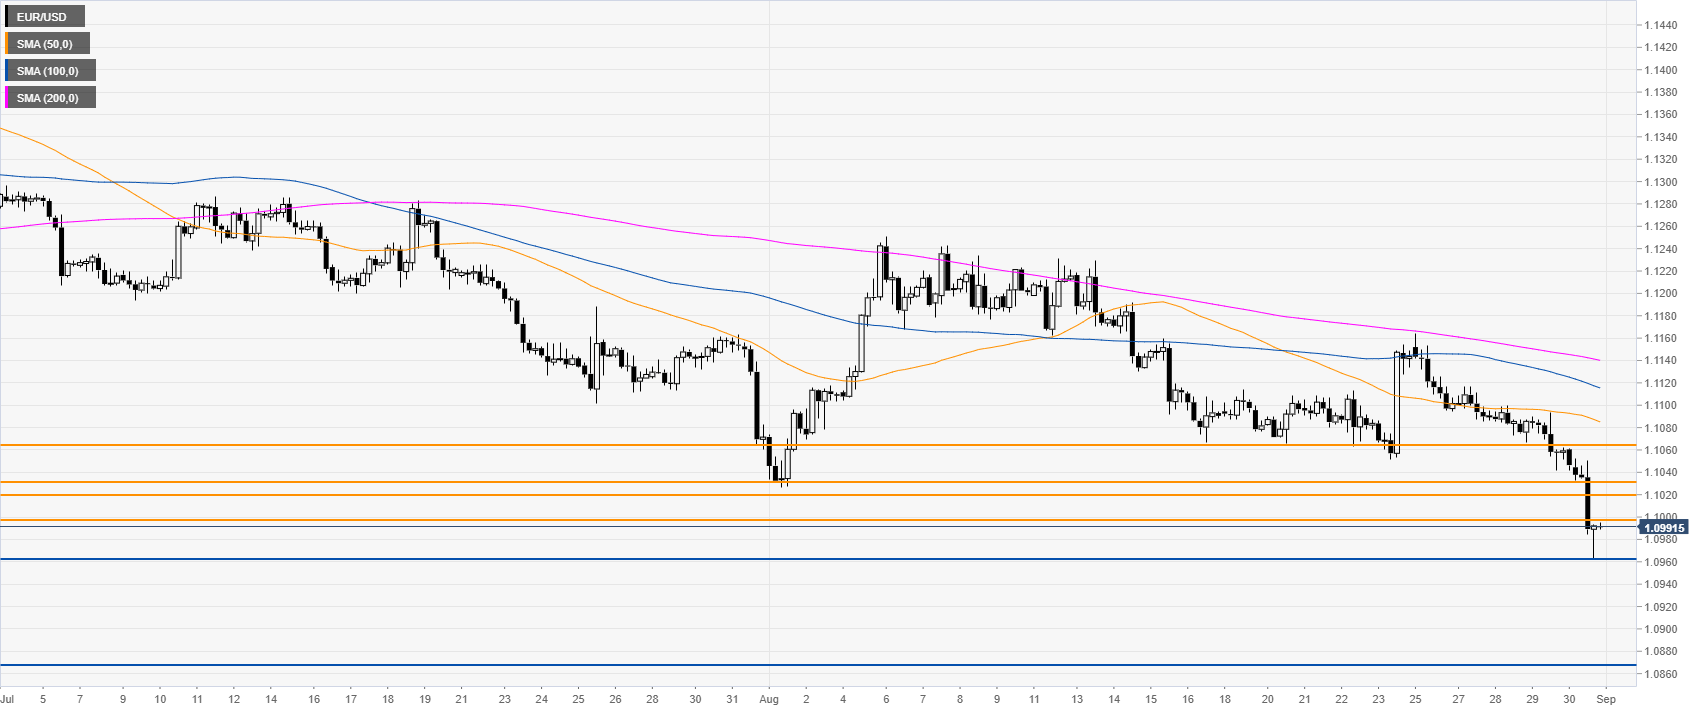
EUR/USD 4-hour chart
The market is under bearish pressure below its main SMAs. EUR/USD found some support at 1.0961. If this support is broken, there is little in the way to 1.0870, according to the Technical Confluences Indicator.
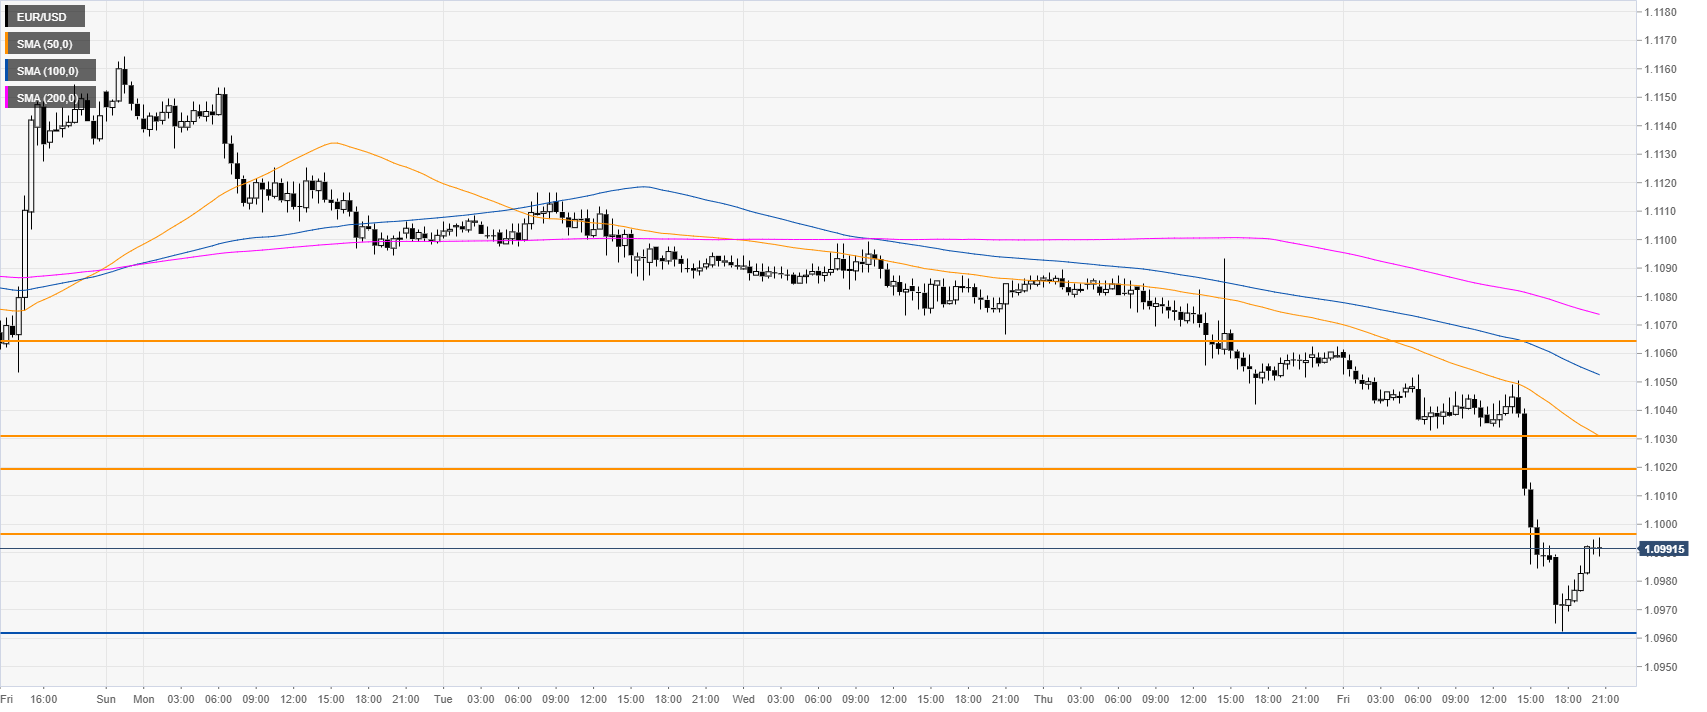
EUR/USD 30-minute chart
EUR/USD is trading below the main SMAs, suggesting a bearish momentum in the near term. Immediate resistances are seen at 1.0996, 1.1019, 1.1030 and 1.1064 levels, according to the Technical Confluences Indicator.
Additional key levels