Back
24 Sep 2019
US Dollar Index technical analysis: DXY off daily lows, near 98.50 level
- The Greenback is down this Tuesday as the market fell near the 98.42 support.
- The level to beat for bulls is the 98.60 resistance level.
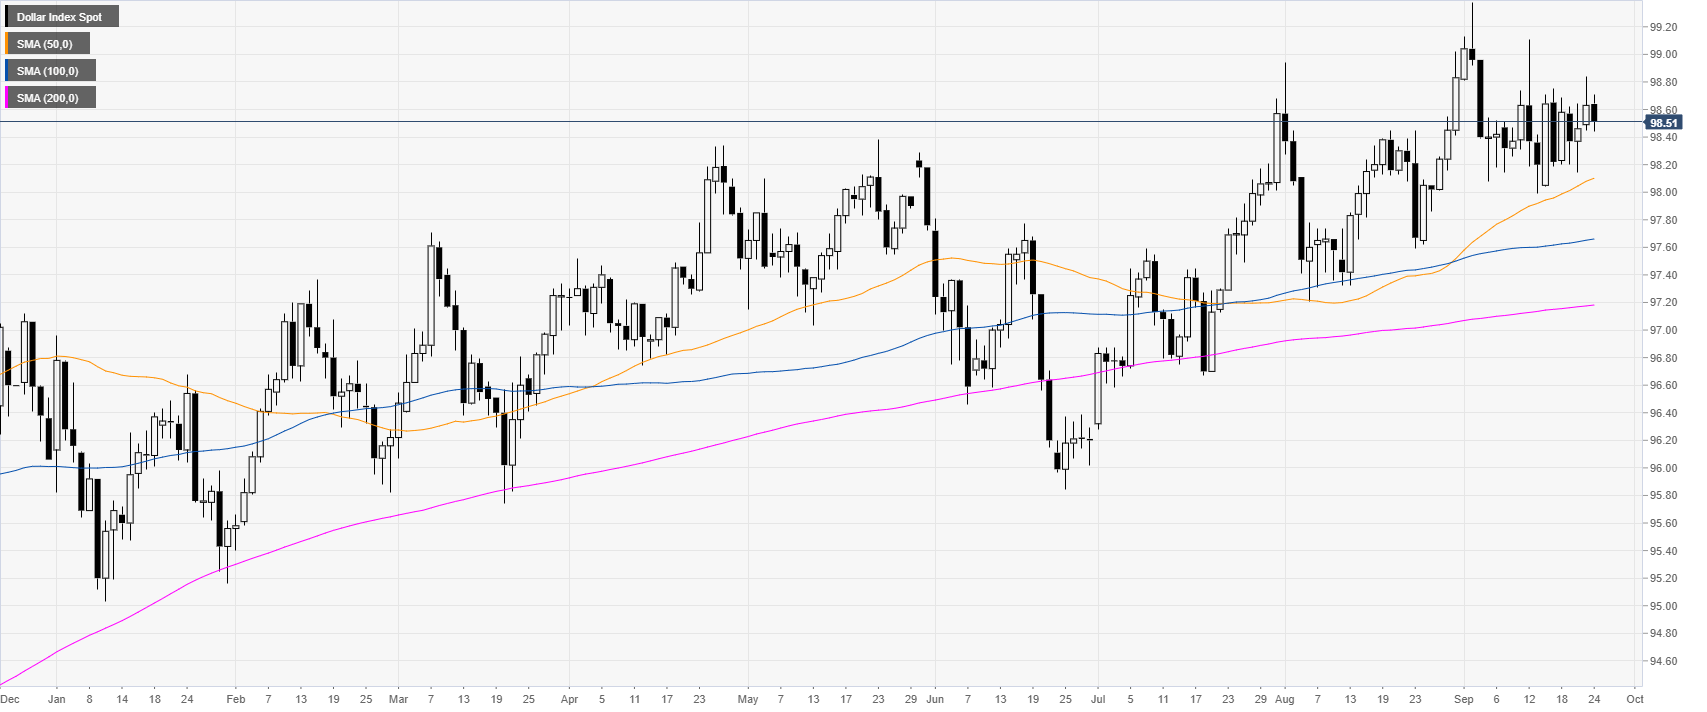
DXY daily chart
DXY (US Dollar Index) is in an uptrend above its main daily simple moving averages (DSMAs). For most of September, the Greenback has been trading in a tight range.
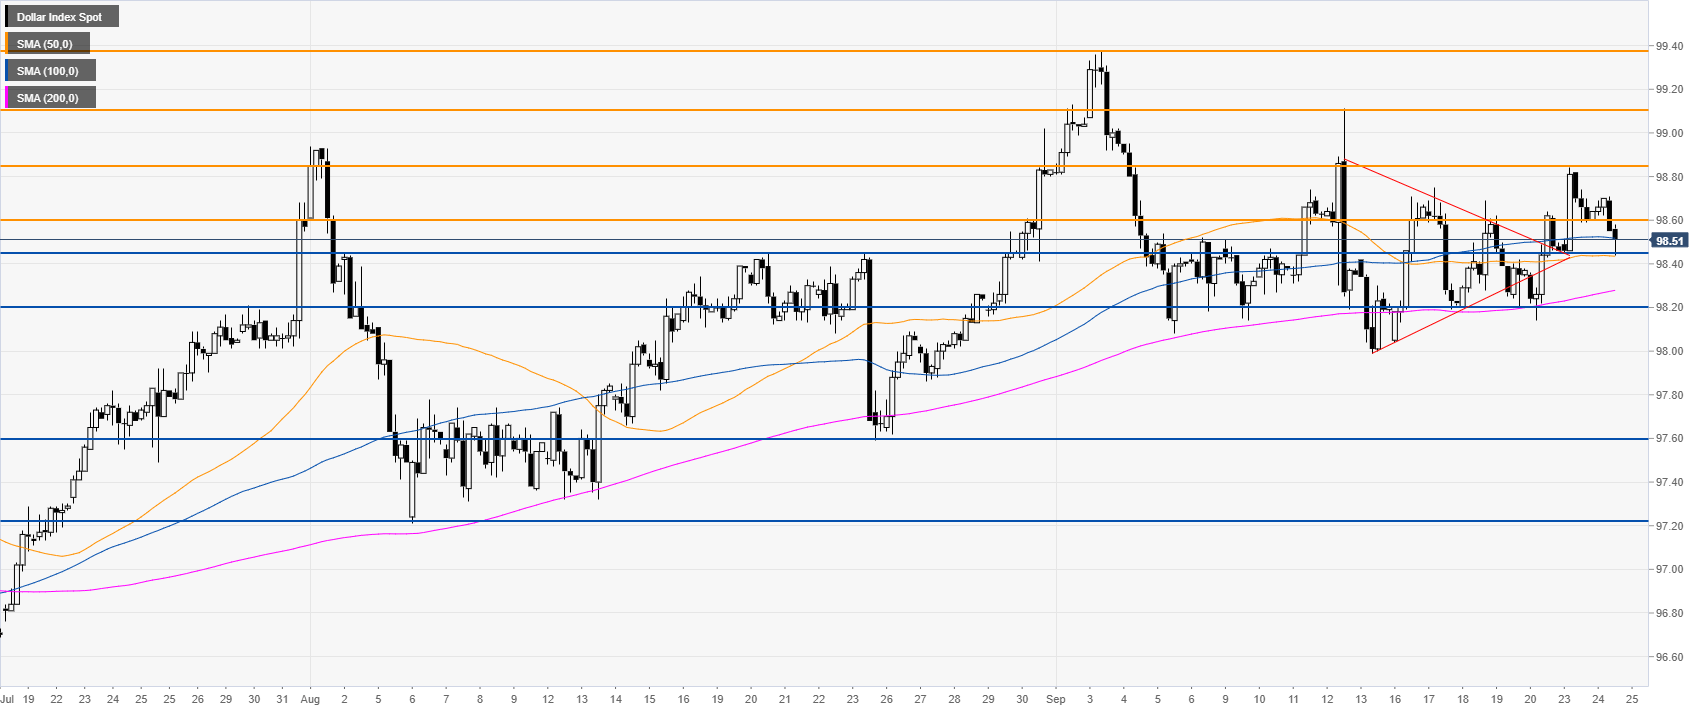
DXY four-hour chart
DXY has retraced down near the 98.42 support. If the market breaks below this level, the triangle pattern will cease to be into effect and a drop to 98.20 could be on the cards.
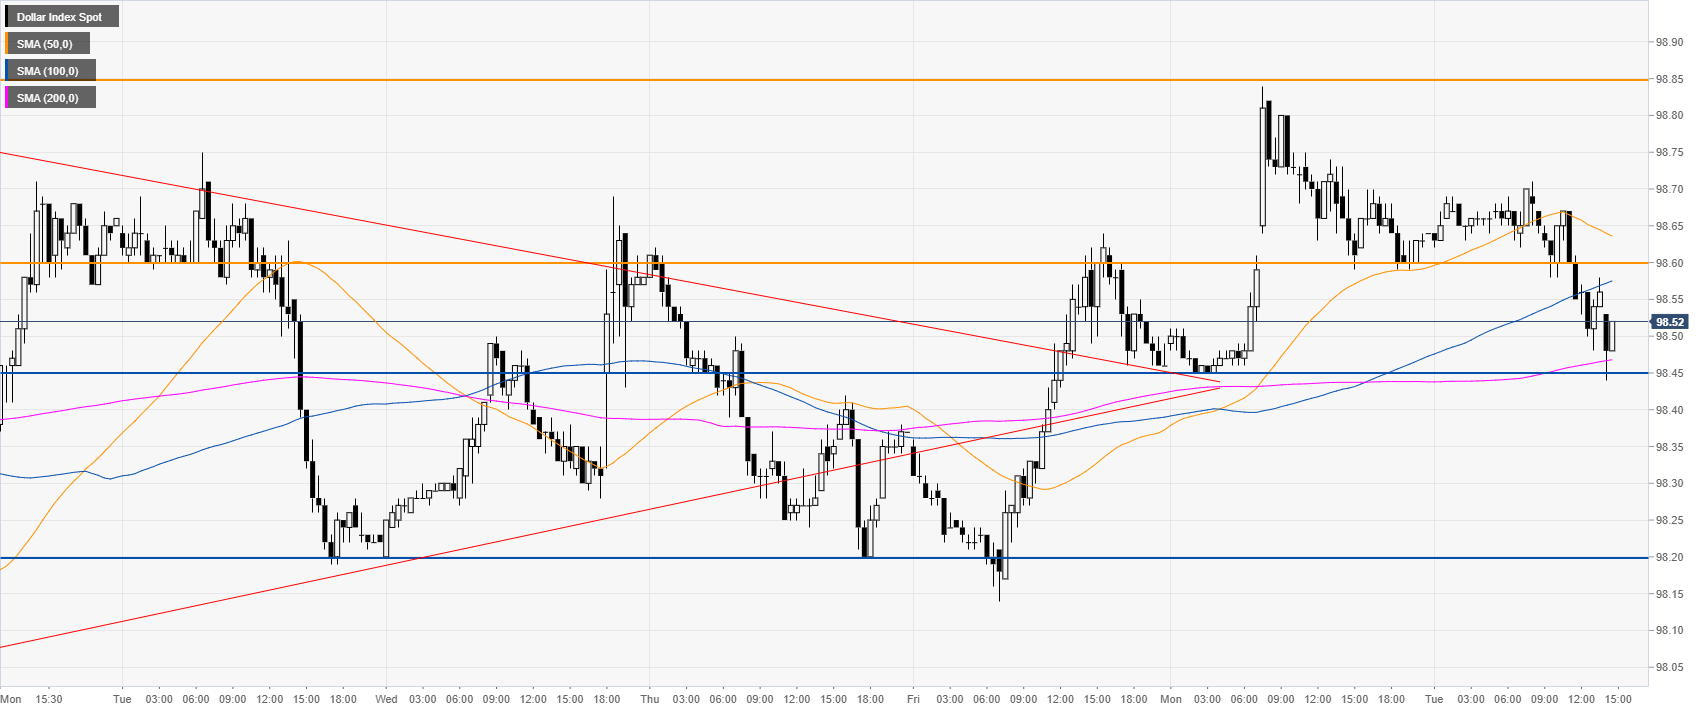
DXY 30-minute chart
DXY is trading between the 100 and 200 SMAs, suggesting a retracement down in the short term. On the way up, a break of 98.60 can expose 98.85 resistance.
Additional key levels