EUR/JPY technical analysis: 121.50, 200-day EMA caps recovery inside rising wedge
- EUR/JPY clings to 50% Fibonacci retracement of April-September declines.
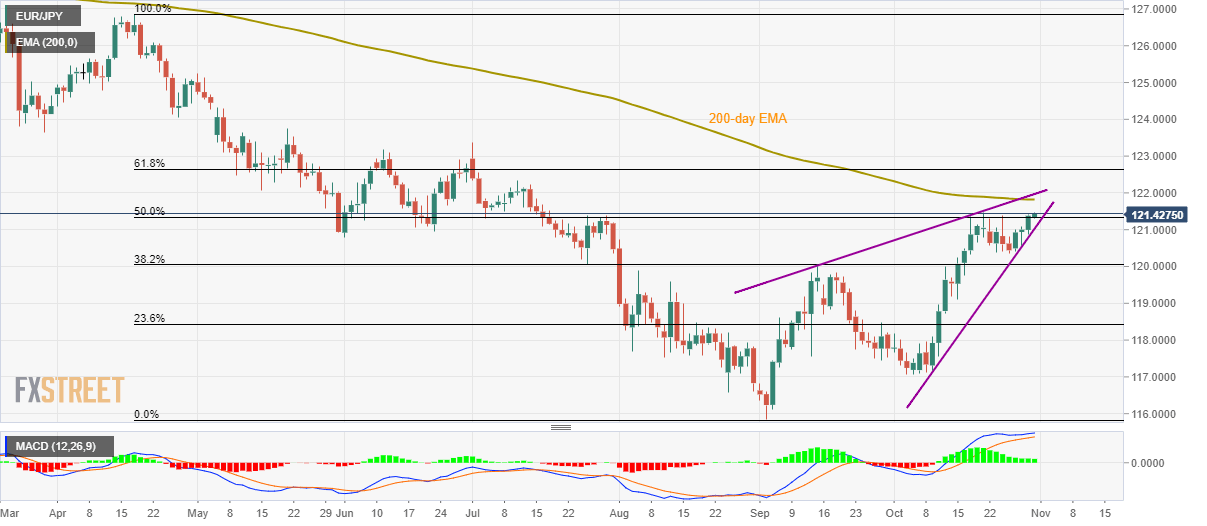
- Short-term rising wedge, repeated failures to cross 121.50 keep sellers hopeful.
Not only multiple pullbacks from 121.50 but the presence of a bearish technical pattern and sustained trading below 200-day EMA also portrays the EUR/JPY pair’s weakness as it takes the rounds to 121.42 during Asian session on Thursday.
As a result, the pair’s break below 121.00, comprising rising wedge’s support, will confirm the bearish formation and could drag the quote down to 118.00. However, 120.30, September month high near 120.00 and 23.6% Fibonacci retracement near 118.40 can entertain bears during the declines.
Meanwhile, 121.50, 200-day Exponential Moving Average (EMA) level of 121.82 and the rising wedge’s upper-line, at 122.00, will keep buyers in check.
Should prices rally beyond 122.00 on a daily closing basis, 61.8% Fibonacci retracement level of 122.65 and July month high near 123.36 could lure the bulls.
EUR/JPY daily chart
Trend: pullback expected