Back


19 Feb 2020
USD/JPY Price Analysis: Dollar surges to 9-month high, breaks above 111.00 figure
- After ten days of consolidation, USD/JPY broke strongly to the upside to fresh 2020 highs.
- The level to beat for bulls is the 111.50 resistance.
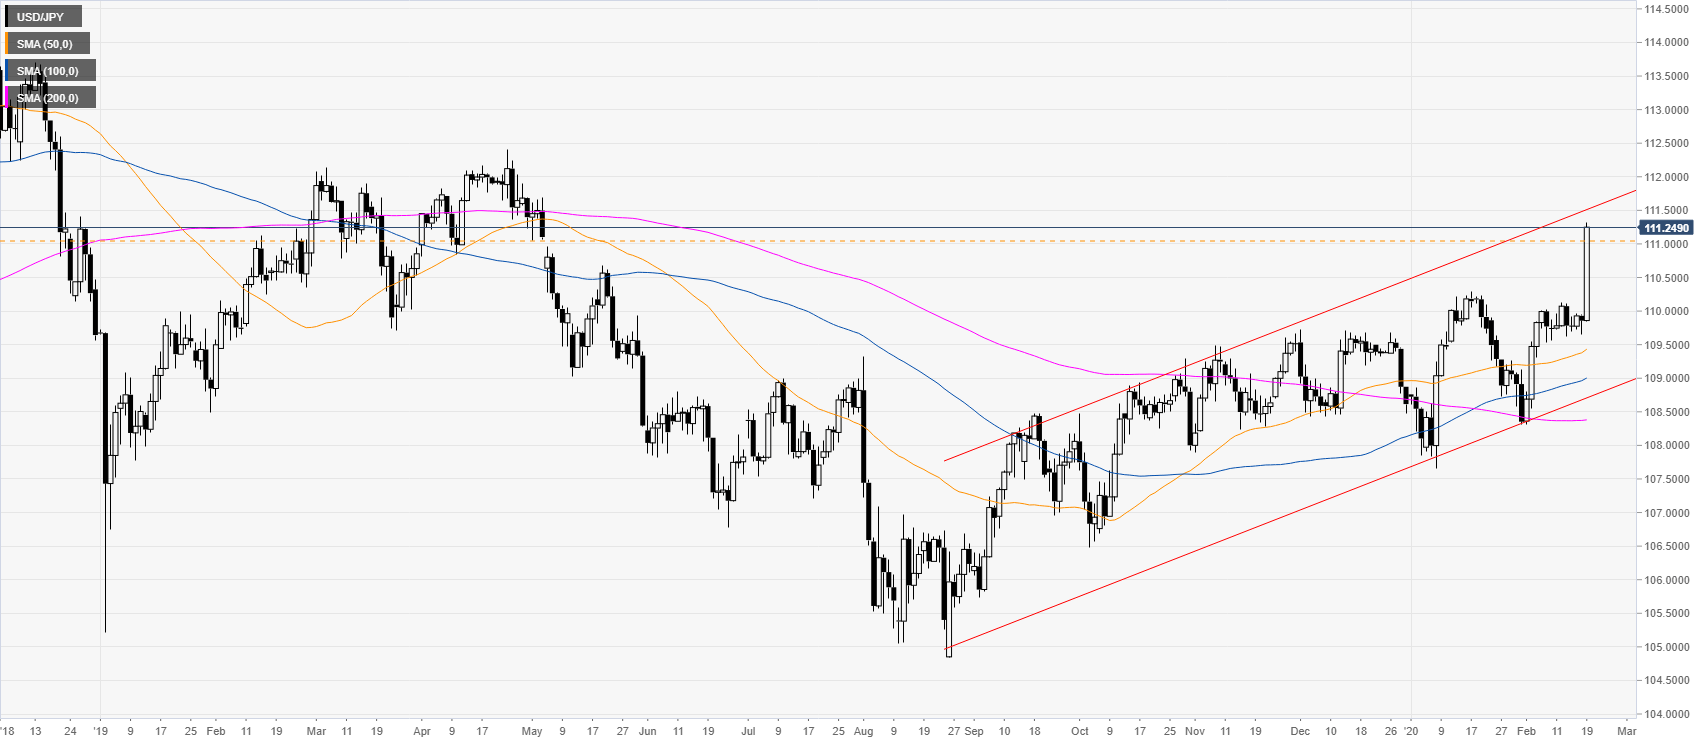
USD/JPY daily chart
USD/JPY is rising sharply breaking above the 111.00 figure and closing a gap from May 2019. The spot is trading in a bull channel while above its daily simple moving averages (SMAs). The market is having an exceptional intraday rally as the average daily range is about three times larger than usual.

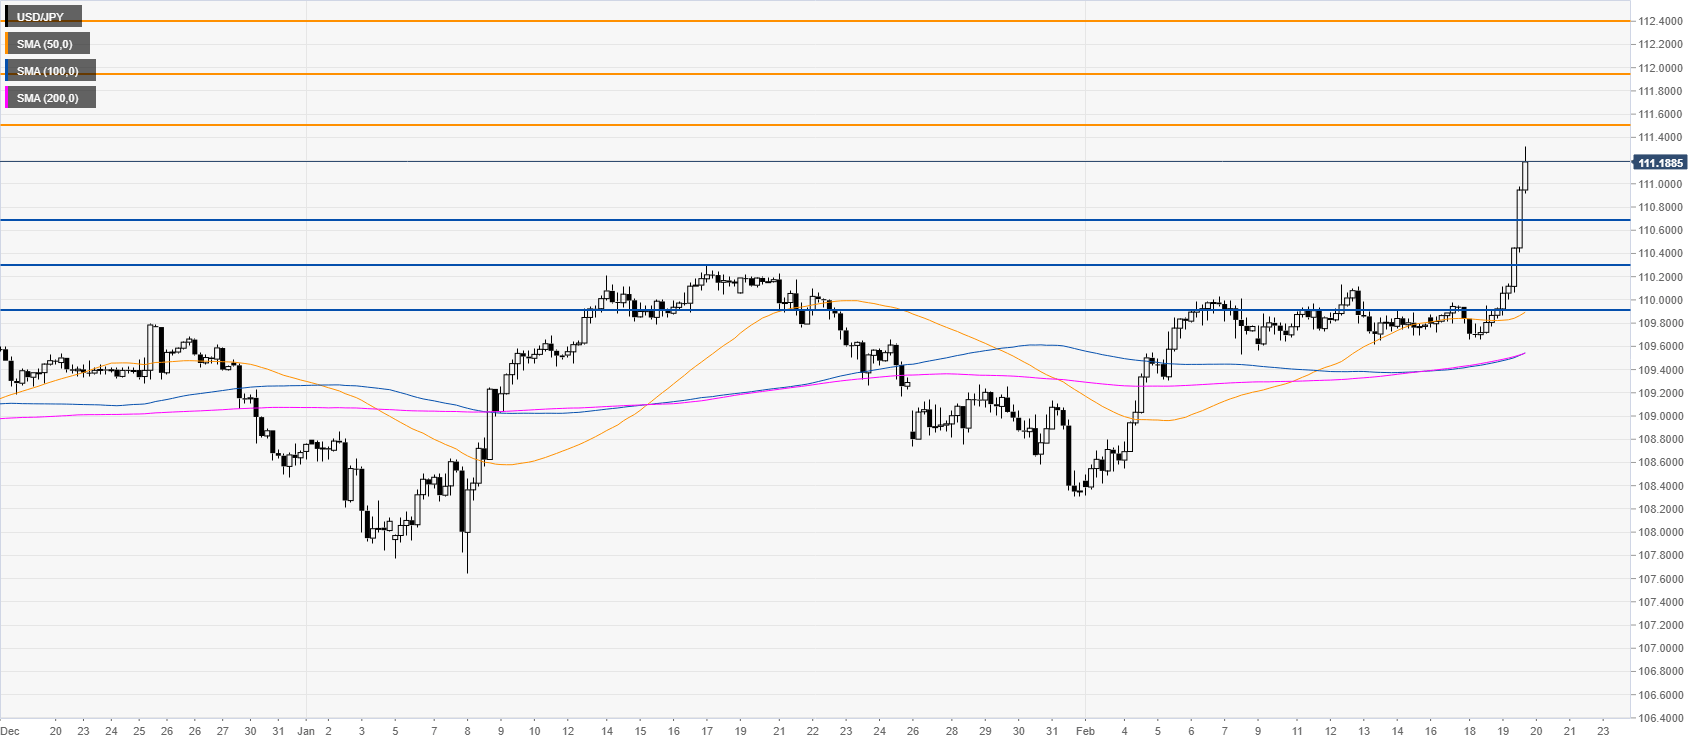
USD/JPY four-hour chart
USD/JPY is printing fresh 2020 highs as the market is spiking above its main SMAs. The market decided to break the range of the last ten days while breaking through several resistance levels, the better market mood and USD strength made bears capitulate. As the bulls are back in control, the spot will focus on the 111.50 resistance to extend gains towards the 111.95 and 111.41 levels. Support can be seen near the 110.69, 110.34 and 109.88 levels, according to the Technical Confluences Indicator.

Resistance: 111.50, 111.95, 111.41
Support: 110.69, 110.34, 109.88
Additional key levels
