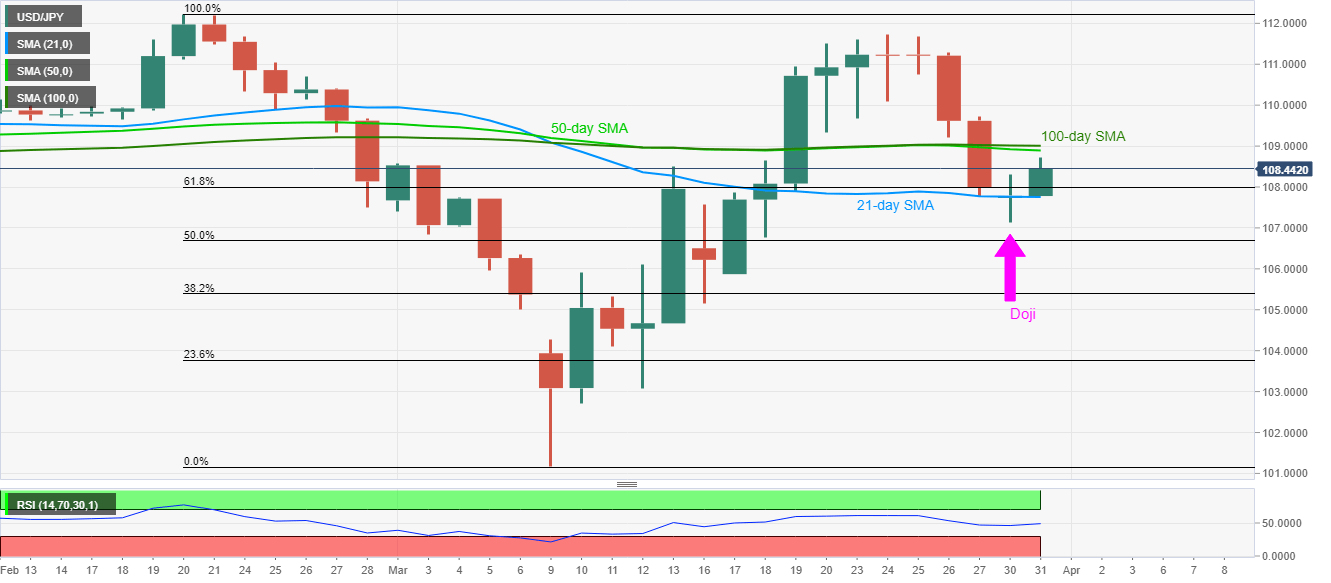
USD/JPY Price Analysis: Pierces 61.8% Fibonacci following Monday’s Doji
- USD/JPY holds onto recovery gains
- The previous day’s trend reversal signaling candlestick formation, sustained break of 61.8% Fibonacci retracement favor buyers.
- 21-day SMA offers immediate support.
USD/JPY takes clues from Monday’s Doji formation while rising 0.63% to 108.45 during the early Tuesday. In doing so, the pair clears 61.8% Fibonacci retracement of its fall from February 20.
Even so, a confluence of 100-day and 50-day SMAs near 108.90-109.00 could question the pair’s immediate upside, a break of which could escalate the recovery moves towards 109.70/80.
It should, however, be noted that the pair’s sustained rise past-109.80 needs a sustained break beyond the monthly top near 111.70/75 to aim for February month high around 112.25.
Meanwhile, a 21-day SMA level of 107.75 offers the immediate support while a daily closing below Monday’s low near 107.10 will defy the candlestick formation and drag the USD/JPY prices towards March 12 high near 106.10.
USD/JPY daily chart

Trend: Further recovery expected
