USD/CNH Price Analysis: Refreshes 4.5-month low, 6.9550 in focus
- USD/CNH remains depressed around the lowest since March 11.
- Oversold RSI conditions could challenge further downside, six-week-old support line may offer bounce.
- Bulls will have to confirm falling wedge to regain market confidence.
USD/CNH stays heavy around 6.9680, down 0.07% on a day, during the early Wednesday. The pair recently dropped to the lowest since early March. However, oversold RSI conditions seem to challenge the bears.
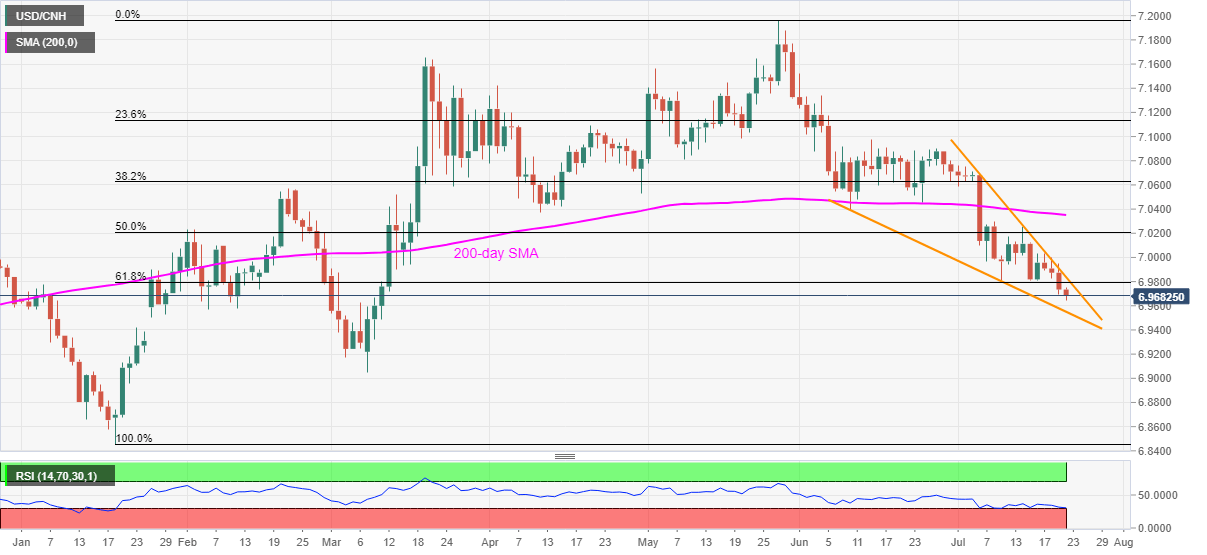
Even so, a sustained trading below 61.8% Fibonacci retracement level of January-May upside, as well as following the monthly resistance line portraying a short-term falling wedge, keeps the sellers hopeful.
Hence, unless confirming the bullish chart pattern, with a daily closing past-6.9840, the pair remains vulnerable to further downside. That makes the pattern’s support, around 6.9550, the key for the pair traders.
Should the quote fails to bounce 6.9550, by ignoring RSI conditions, the March month’s low near 6.9050 and 6.9000 round-figures may lure the pessimists.
Meanwhile, 61.8% Fibonacci retracement level around 6.9800 may guard the pair’s immediate upside ahead of the falling wedge’s resistance line near 6.9840.
During the quote’s sustained rise past-6.9840, 50% Fibonacci retracement and 200-day SMA can entertain the buyers around 7.0210 and 7.0350 respectively.
USD/CNH daily chart
Trend: Bearish