Gold Price Analysis: Bulls continue to target 50% mean reversion of weekly bearish impulse
- Gold prices holding at critical support on both the daily and 4-hour time frames.
- Bulls continue to eye a 50% mean reversion of weekly bearish impulse.
As per the prior analysis, Gold Price Analysis: XAU/USD bulls testing critical daily resistance, there remains a focus on the weekly 50% mean reversion confluence with old support.
Prior analysis
Weekly chart
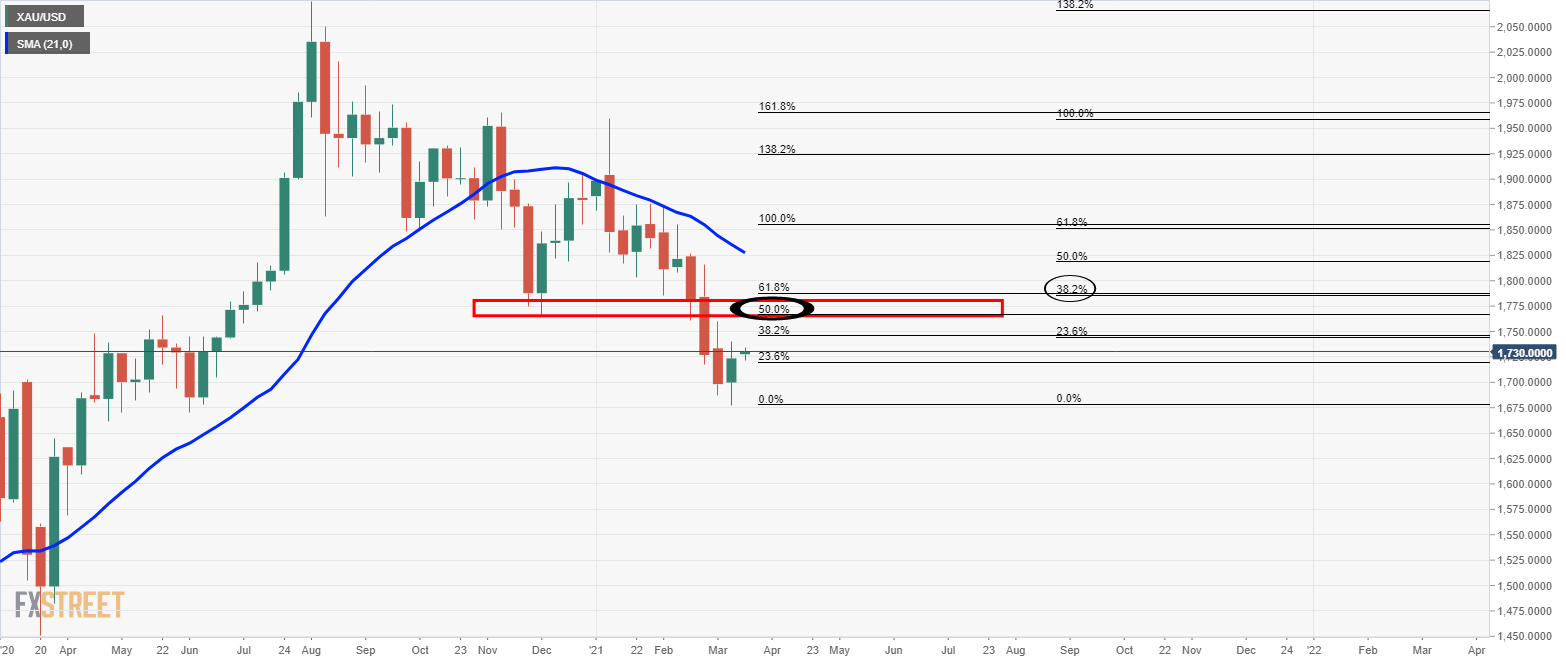
Bulls have their eyes on a move back to test old support and a 50% mean reversion.
Daily chart
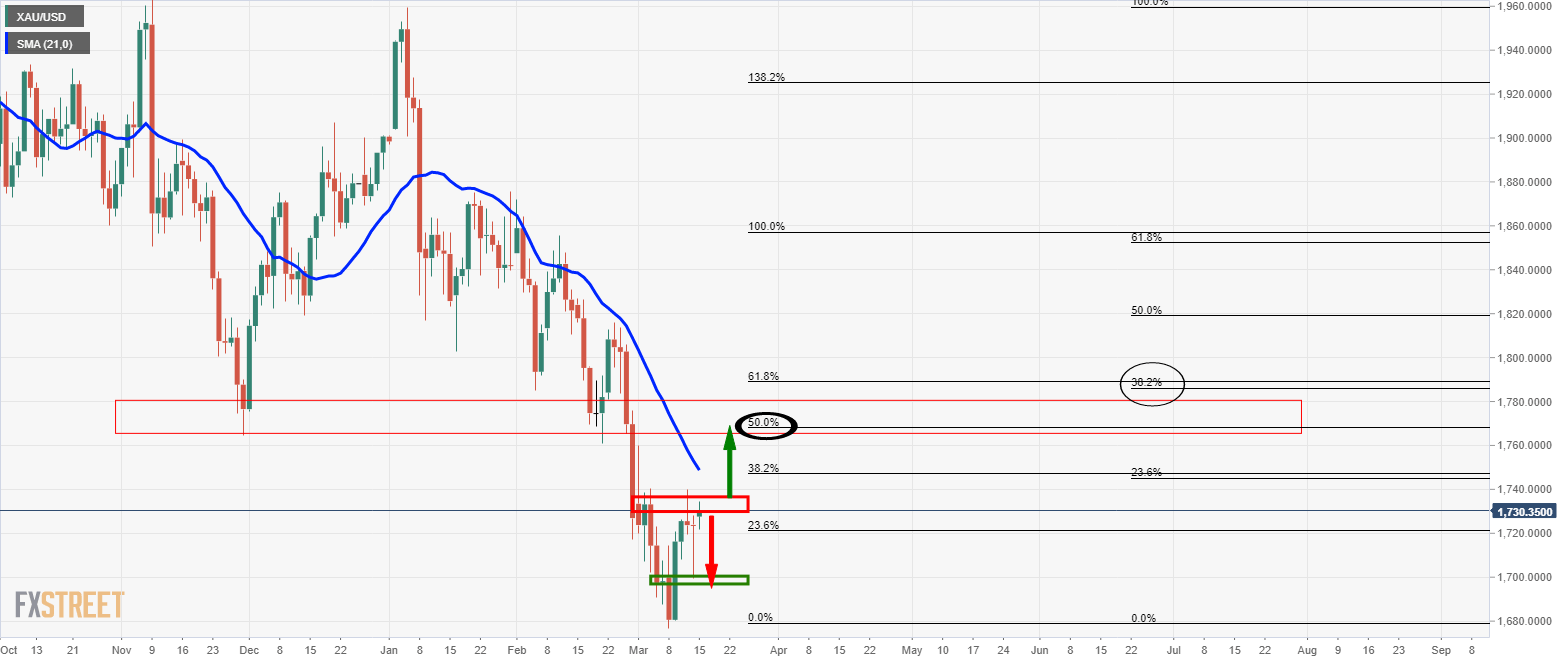
The daily chart shows the price is at a crossroad.
At resistance, there is the possibility of a return back to test the support and would leave the price trapped.
On a break of resistance, there are the prospects of a run back to test the 21-D SMA which would meet a 50% mean reversion of the weekly bearish impulse.
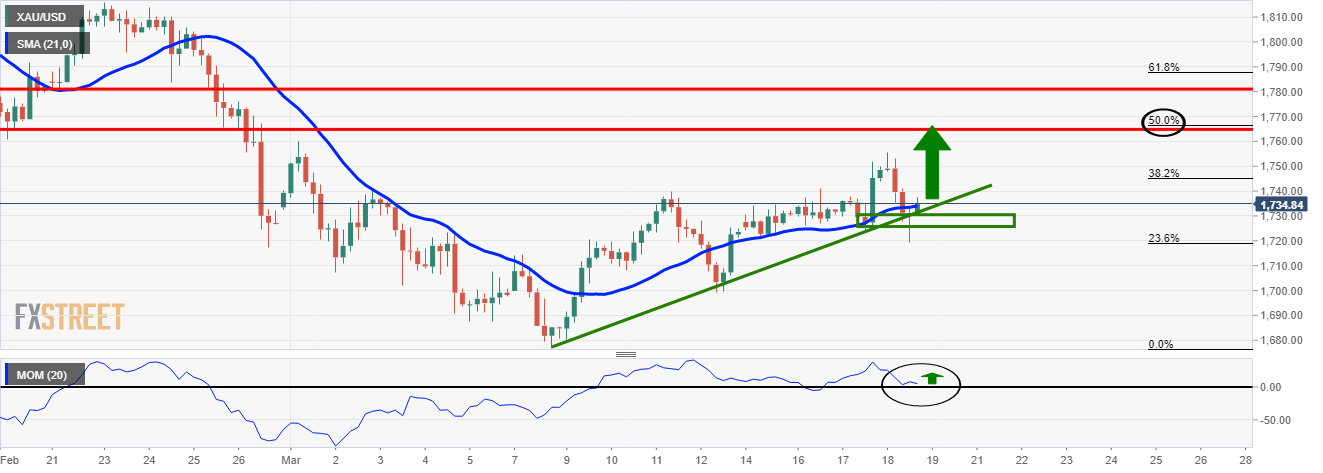
Live market, daily and 4-hour charts
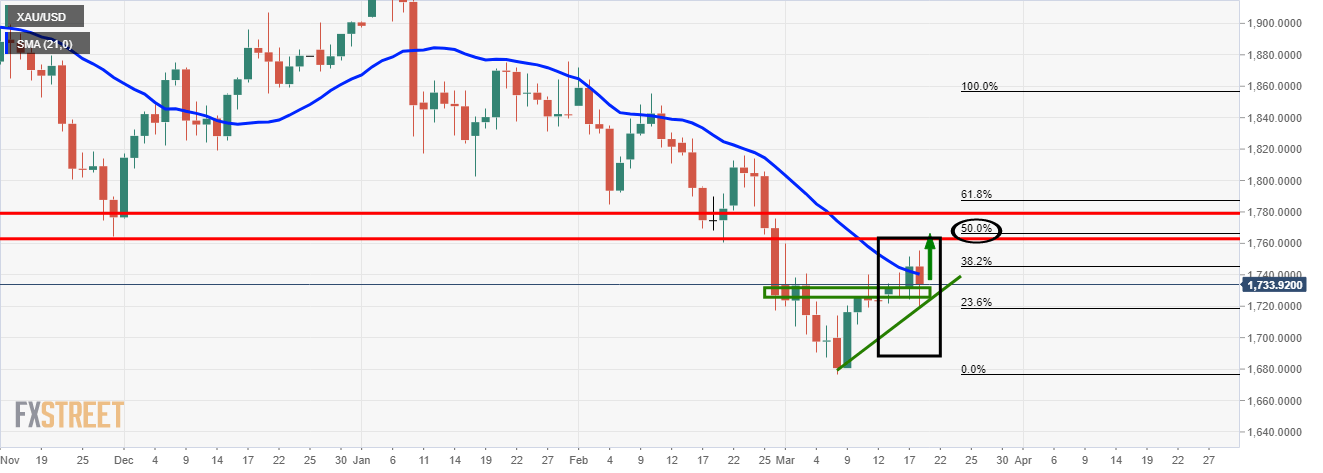
The daily chart, above, has taken out the daily resistance that would now be expected to act as support.
The 4-hour chart, below, shows that the price is holding at support in a confluence of the 21-SMA, the rising trend-line support and prior resistance.