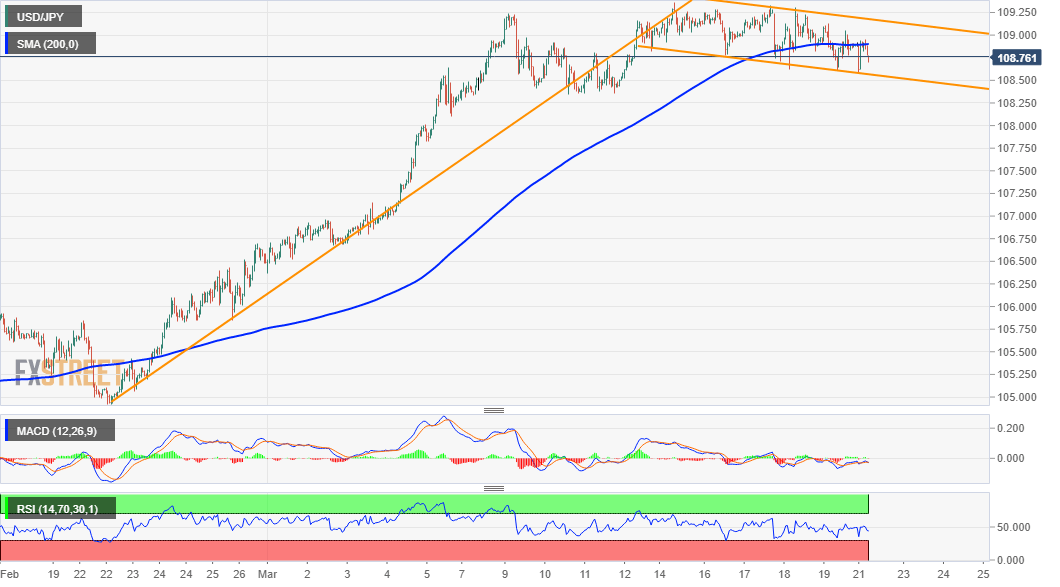
USD/JPY Price Analysis: Bullish continuation flag pattern spotted on hourly charts
- USD/JPY has been retreating along a downward sloping channel on short-term charts.
- The mentioned channel now constitutes the formation of a bullish flag chart pattern.
- Mixed oscillators on hourly/daily charts warrant caution before placing aggressive bets.
The USD/JPY pair filled the weekly bearish gap opening, albeit struggled to capitalize on the move and quickly retreated around 20 pips from the 109.00 neighbourhood.
A cautious mood around the equity markets benefitted the safe-haven Japanese yen. Apart from this, sliding US Treasury bond yields held the US dollar bulls from placing aggressive bets and further collaborated to cap the upside for the USD/JPY pair.
From a technical perspective, the uptick faltered near 200-hour SMA, which should now act as a key pivotal point for short-term traders. That said, the USD/JPY pair, for now, has managed to hold above the lower end of over one-week-old descending channel.
Given the recent strong positive move over the past six weeks or so, the mentioned channel constitutes the formation of a bullish flag pattern. The bullish set-up is reinforced by the fact that oscillators on the daily chart have just eased from overbought conditions.
That said, technical indicators on hourly charts have been drifting lower in the bearish territory and warrant some caution before positioning for any further appreciating move. In the meantime, the 200-hour SMA near the 109.00 mark might continue to cap the upside.
This is followed by the trend-channel resistance, around the 109.15-20 region, which if cleared decisively will be seen as a fresh trigger for bullish traders. This, in turn, will set the stage for a move towards reclaiming the key 110.00 psychological mark.
On the flip side, a sustained break below the trend-channel support, currently near the 108.55-50 region will negate the positive bias and prompt some technical selling. The USD/JPY pair might then correct further towards testing the 108.00 round-figure mark.
USD/JPY 1-hourly chart

Technical levels to watch
