Palladium Price Analysis: XPD/USD pierces weekly resistance on the way to $2,940 hurdle
- Palladium picks up bids after crossing near-term key hurdle.
- Key Fibonacci retracement, HMA stand tall to test upside.
- Momentum line suggests weakness in the recent upside trend.
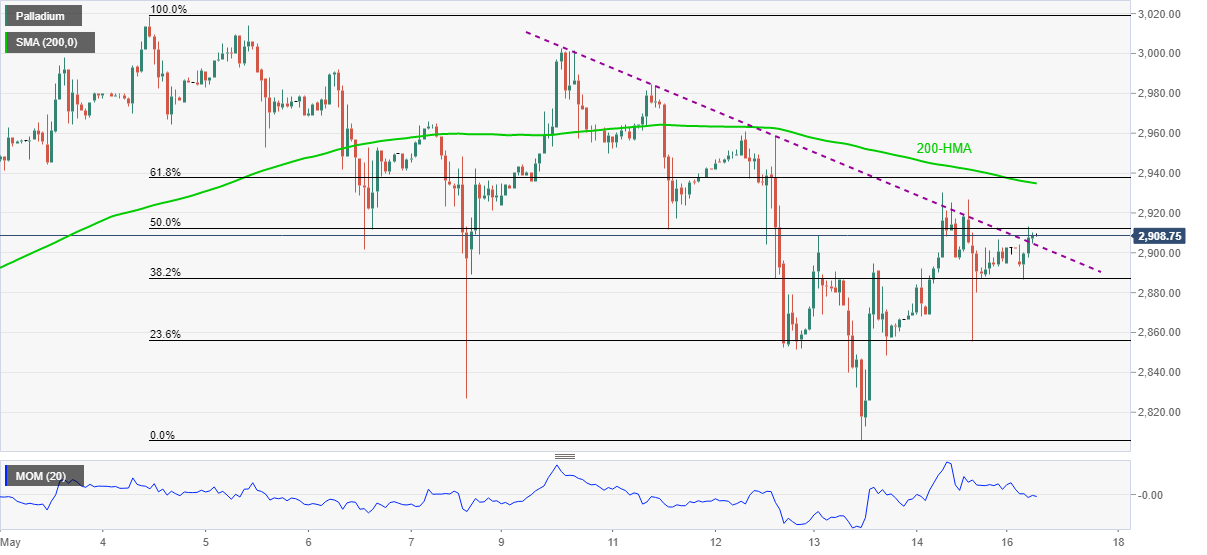
Palladium (XPD/USD) defends $2,900, up 0.38% intraday around $2,908, during early Monday. The precious metal recently crossed a one-week-old falling trend line resistance, now support.
However, downbeat Momentum may stop the XPD/USD bulls from crossing the $2,935-40 resistance area comprising 61.8% Fibonacci retracement of May 04-13 downside, as well as 200-HMA.
Also acting as upside barriers are the levels marked during the last week surrounding $2,960 and the $3,000, not to forget the record top near $3,020.
Meanwhile, pullback moves below the immediate support line, previous resistance, near $2,900 have multiple supports around $2,890 and $2,850 before directing Palladium sellers toward the monthly bottom close to $2,805.
The bearish impulse may gain momentum and test March’s high near $2,755 on the break of $2,805.
Palladium hourly chart
Trend: Further recovery expected