GBP/USD Price Analysis: The bulls are in charge and target a test into 1.37 area
- GBP/USD bull sin charge as the dollar softens following the Fed.
- Daily M-formation is compelling toward the 61.8% ratio.
GBP/USD has been bid over the last 24-hours on the back of the looming Bank of England as well as a slide in the US dollar that gave back some territory following the Federal Reserve on Wednesday. This has left cable mitigating the space between 1.3690 and 1.3660 from a technical standpoint.
The following illustrates the prospects of a test in the 1.37 area for the forthcoming session and also the possibility of mitigation of the lastest bullish rally from the 1.3660s.
GBP/USD H1 analysis
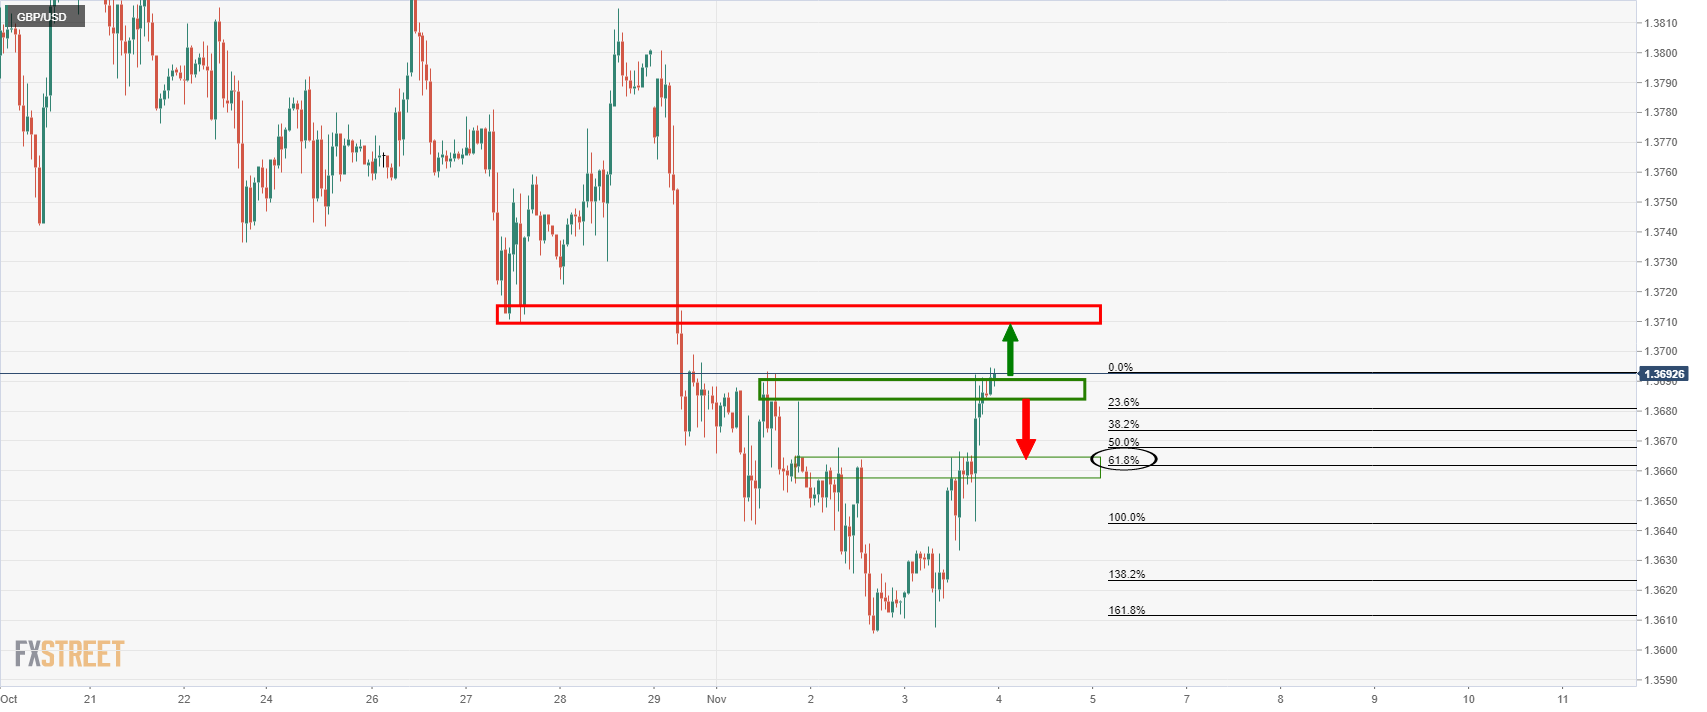
The price is already forming a support structure which gives rise to the likelihood of an onward journey into the 1.37 area. However, a correction to the 61.8% Fibo, based on current ranges, is not out of the question leading into the BoE event on Thursday.
GBP/USD daily chart
From a daily perspective, there is a meanwhile bullish bias to test into resistance prior to a downside continuation as follows:
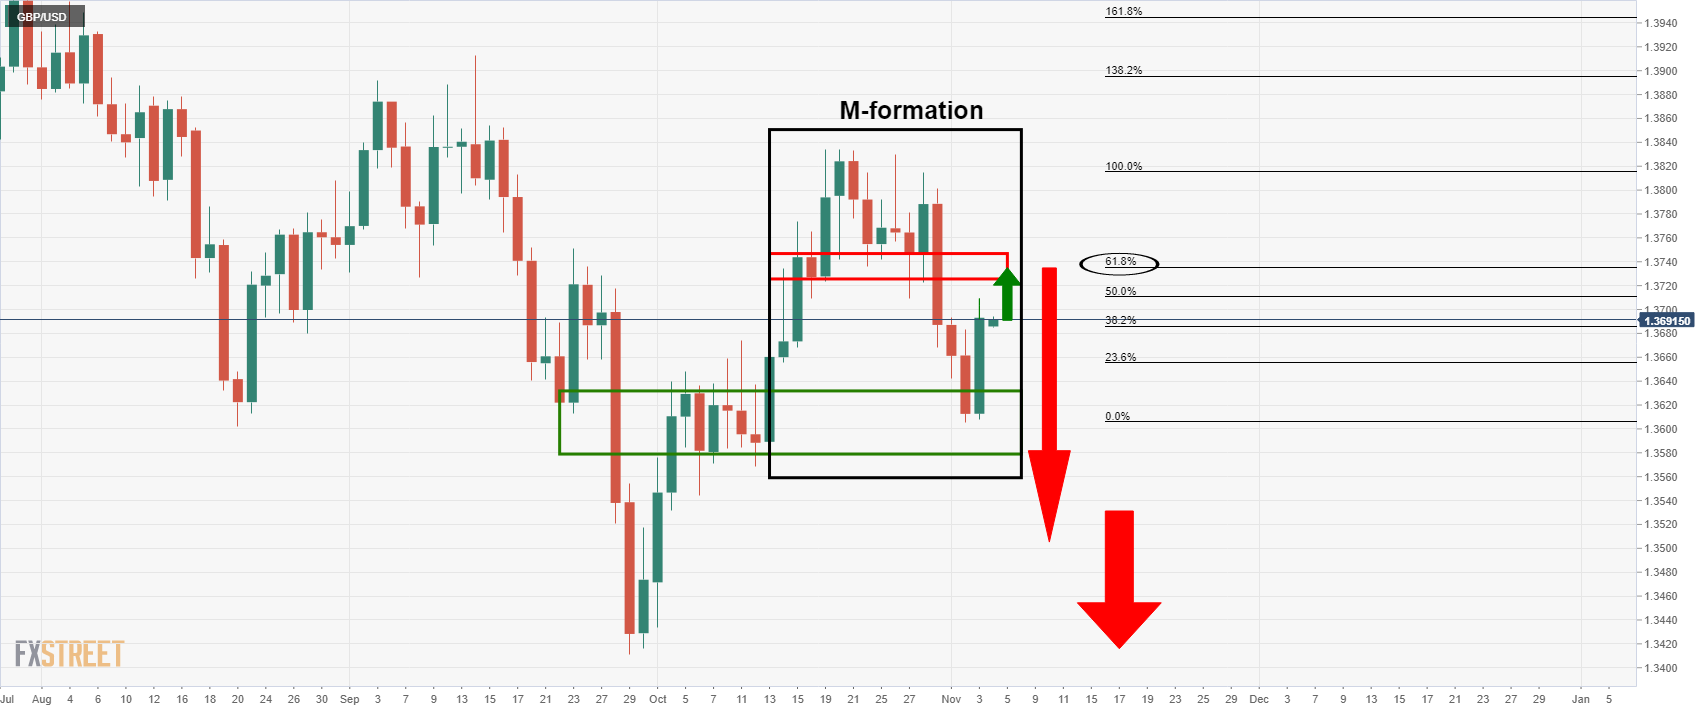
The price has formed an M-formation on the charts and the neckline of the formation would be expected to pull in the price to test the 61.8% Fibo prior to the next downside impulse, depending on the outcome on the Bank of England.