GBP/USD Price Analysis: Stays pressured towards 1.3155
- GBP/USD pauses on the way to fresh yearly low.
- 200-week SMA, 38.2% Fibonacci retracement offers strong support.
- October’s bottom guards immediate upside, half-yearly resistance line is the key.
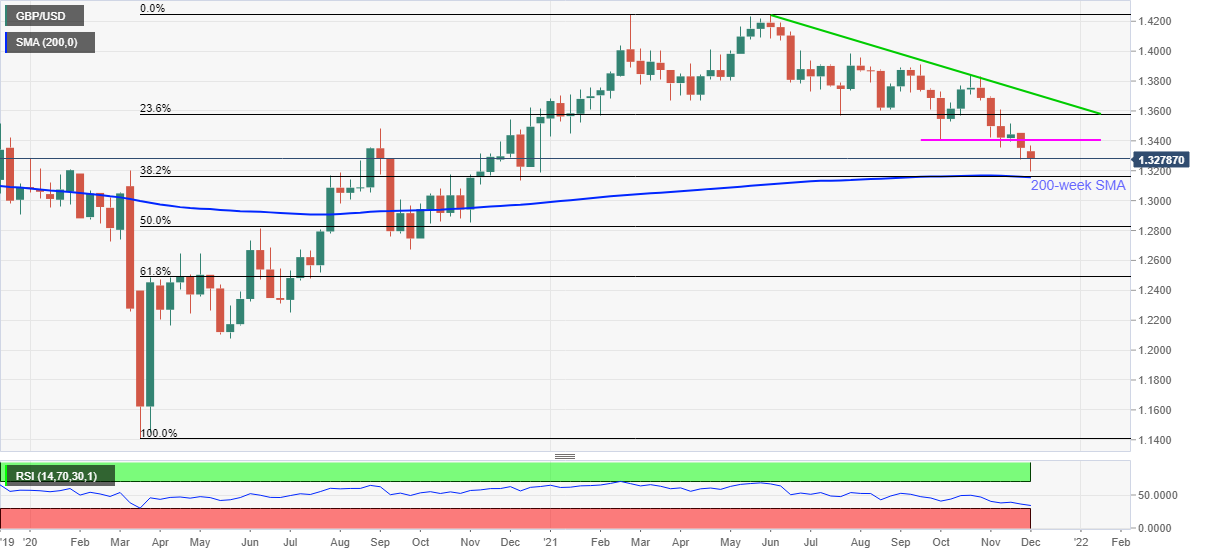
GBP/USD holds lower grounds near 1.3280, retreating towards the yearly low during Thursday’s Asian session. Although the cable pair grinds above the 2021 bottom marked on Tuesday, descending RSI line and sustained trading below the short-term key support, now resistance, keeps bears hopeful.
That said, a convergence of the 38.2% Fibonacci retracement (Fibo.) of March 2020 to June 2021 upside and 200-week SMA surrounding 1.3155 lures the sellers should they manage to conquer the latest yearly low of 1.3194.
It should be noted, however, that the RSI line inches closer to the oversold territory and hence can stop the GBP/USD bears around the stated strong support of 1.3155, failing to which can direct the quote towards the 1.3000 psychological magnet.
Meanwhile, an upside break of the October’s low surrounding 1.3410 becomes necessary for even short-term buyers to take the risk. Following that, 23.6% Fibo. level of 1.3580 may lure the bulls.
However, GBP/USD advances past 1.3588 will be considered elusive until the quote stays below a six-month-old descending resistance line, around 1.3720 by the press time.
GBP/USD: Weekly chart

Trend: Further weakness expected
