USD/CAD Price Analysis: Bulls are moving in at 1.36 round number, eyes on NY open range's low
- USD/CAD bears have moved in but there could be prospects of a bullish correction.
- A retest of the NY open's range could be in order for the day ahead.
The chart below chart illustrates the key levels that include the opening hour's range of the New York session that could see the price drawn to in the coming sessions for a retest where the lows of the range meet a 38.2% Fibonacci retracement near 1.3660.
USD/CAD H1 chart
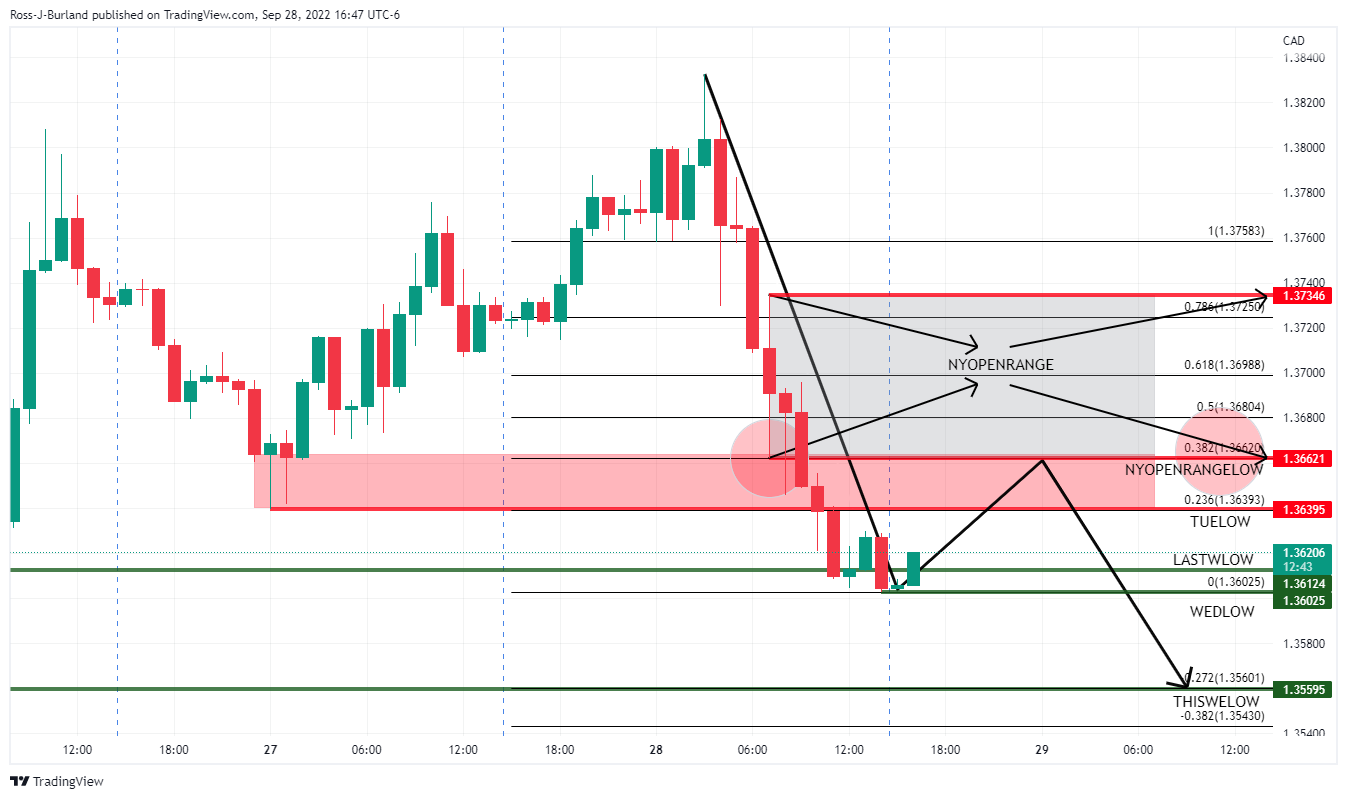
On the way there, the price will need to break back above Tuesday's low of 1.3640. If this area were to hold, then there will be prospects of a deeper move through last week's low again of 1.3612 and Wednesday's low of 1.3602 to retest this week's low of 1.3559 that could be broken should month-end flows accelerate the squeeze on long dollar positions.
USD/CAD weekly chart
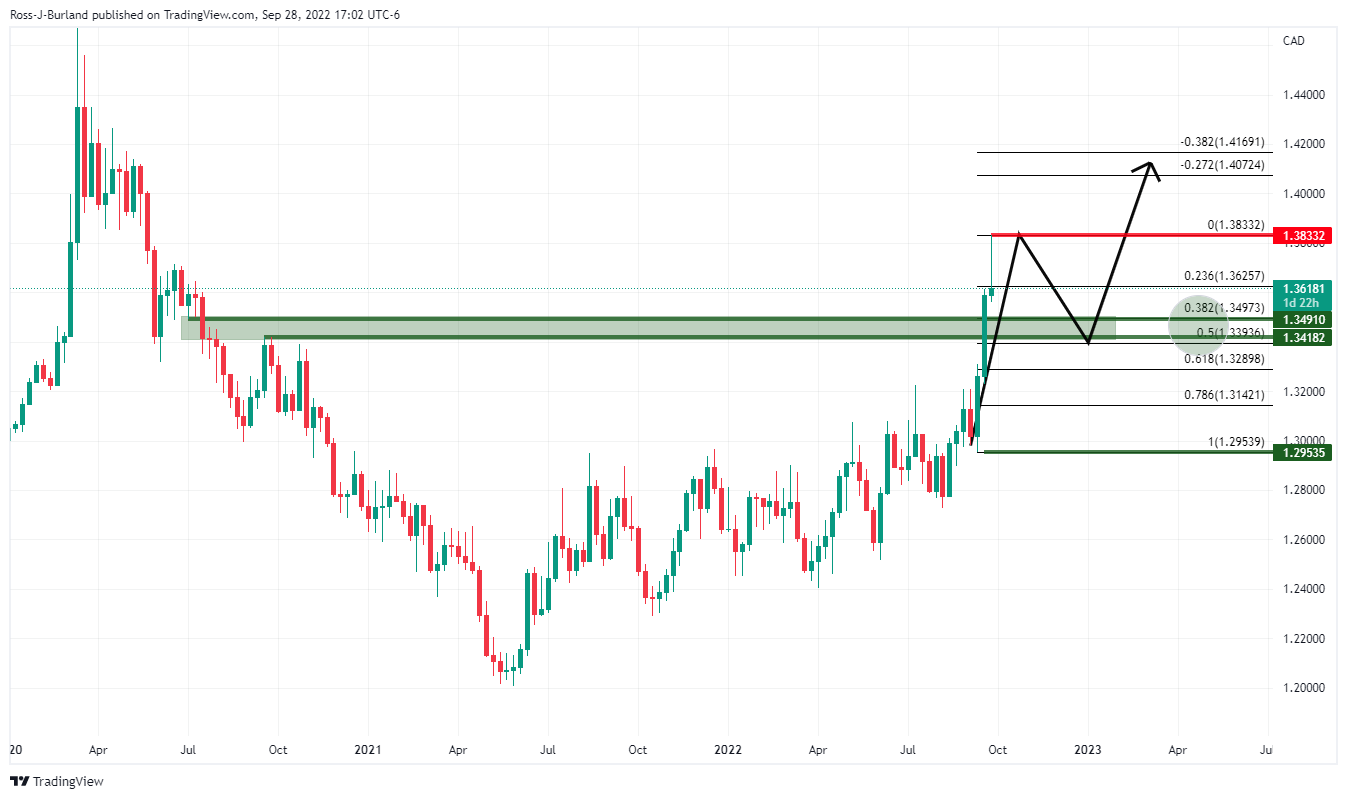
If the price continues to deteriorate, as per the above thesis, then a 38.2% Fibonacci correction of the weekly bullish impulse aligns with around 1.35 the figure. This could be a feasible target should this week's low, so far, give out for a fresh low for the current week. Following the shake-out, there could be prospects of a surge higher again if markets commit to the US dollar again as fundamentals once again take over.